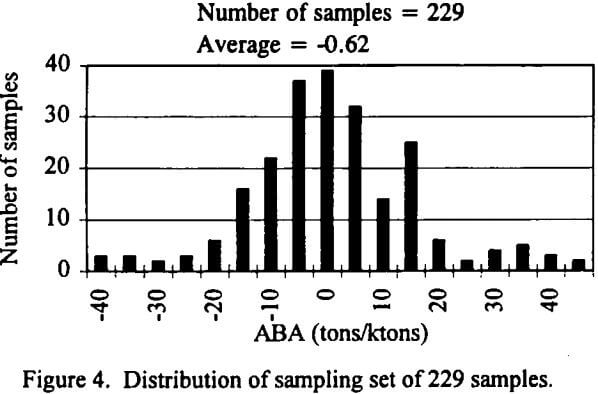
Our approach is to let the variability in the samples dictate how many samples should be collected and analyzed, and then to quantify and defend the results by means of standard statistical methods. This approach is illustrated in Figures 1 through 4, in which a distribution of acid-base accounting (ABA) values is shown for increasing numbers of tailings samples collected from a large tailings impoundment located in the western United States (the graphs could illustrate any other variable, such as grain size, porosity, or metals concentrations). Clearly, from Figure 1, the distribution of ABA values is not well defined on the basis of only 20 samples. For these 20 samples the range of values and the mean value of 9.2 tons CaCO3/1000 tons of tailings (tons/kton) are misleading.
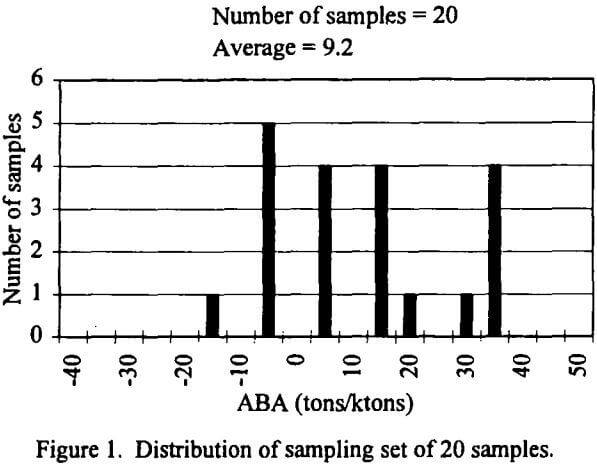
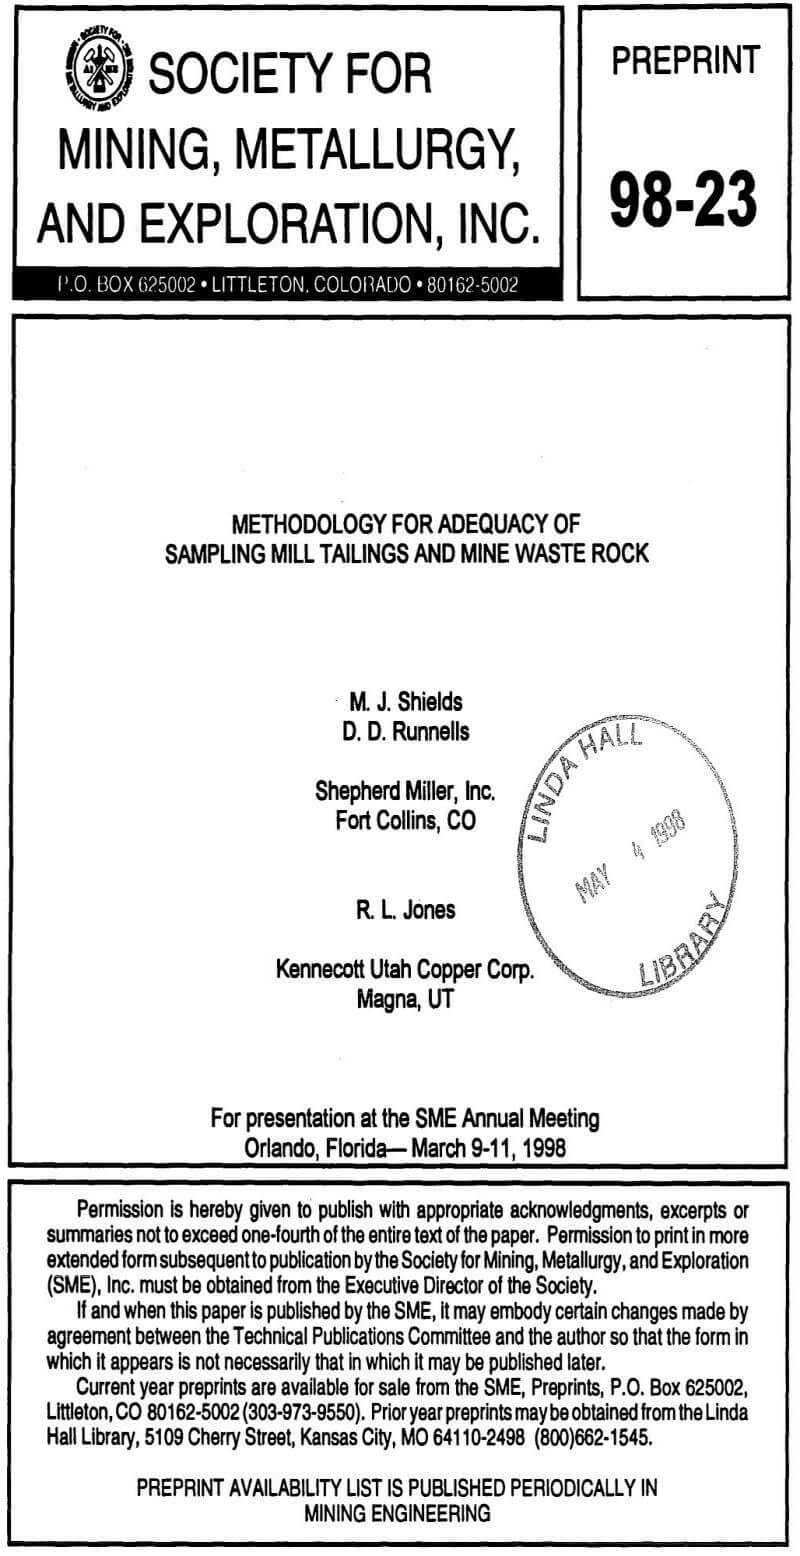
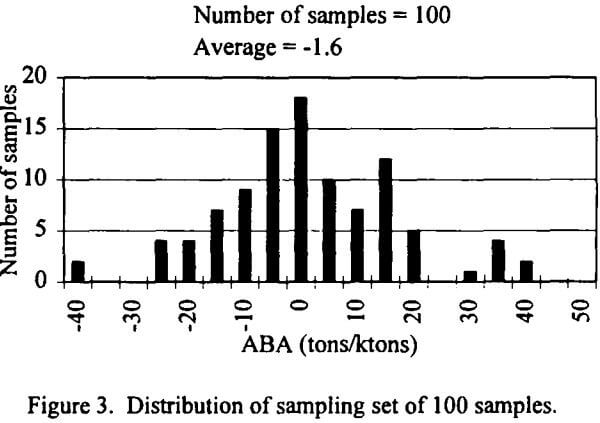
Figure 2 shows that increasing the number of samples provides a more representative distribution. On the basis of these 50 samples the distribution of values and the mean value (5.3 tons/kton) are better defined. For this particular site, however, the appropriate number of samples is best illustrated by Figure 3, in which 100 samples yield a clear distribution (-1.6 tons/kton) that approached the final evaluation shown in Figure 4.
Now consider the effect of adding 129 samples (Figure 4). The addition of 129 additional samples, more than doubling the cost of all preceding samples, changes the mean ABA value by only 0.98 tons/kton (-0.62 tons/kton versus -1.6 tons/kton). Clearly, the additional information to be gained from the expenditure of more than twice the amount of money is not cost-effective. In fact, it can be shown statistically that the addition of 500 more samples does not significantly change the estimate of mean ABA or the conclusions.