
Table of Contents
Investigations were conducted by the U.S. Bureau of Mines to develop flowsheets for the recovery of tungsten and gold from four Alaskan scheelite-bearing ores. Basic gravity concentration and cyanide leach tests were performed on all samples. About 46 pct of the tungsten and 30 pct of the gold from one sample were recovered in a gravity concentrate containing 24 pct WO3 (tungstic oxide) and 119 troy ounces per short ton (tr oz/st) Au. Froth flotation of the gravity concentrate resulted in separate tungsten and gold products with grades of 38 pct WO3 and 2,720 tr oz/st Au and recoveries of 60 and 97 pct, respectively. Additional gold was recovered from the gravity and flotation tailings by cyanidation. Overall recoveries of tungsten and gold from this sample were 28 and 94 pct, respectively.
A flowsheet with mill design parameters was developed that consisted of (1) free gold and scheelite recovery by gravity methods and froth flotation and (2) fine-grained gold recovery by cyanide leaching of reground gravity and flotation tailings, followed by a carbon-in-pulp (CIP) circuit. Data were developed from the Bond mill work index, gold and tungsten flotation, conventional and high-rate thickening, cyanide leaching, and CIP adsorption tests.
The United States is highly dependent on imports for many mineral products that are critical to its economy. Most known domestic sources for these minerals are subeconomic. Therefore, the U.S. Bureau of Mines is investigating the mineral potential of relatively unexplored regions such as Alaska and the Pacific Northwest. If important mineral deposits are found and processes are developed to recover these metals, the United States could reduce its dependence on imports.
Some mineral types that have been identified in Alaska are various gold-in-quartz ores that also contain tungsten bearing scheelite. The United States imported 80 pct of the tungsten consumed in 1987, up from 50 pct in 1981. With no U.S. tungsten mines operating in 1987, tungsten consumption was supplied from imports and Government stockpile excesses. Although the United States is also a net importer of gold, many gold operations exist nationwide and an active interest remains in developing existing gold resources. The primary goal of this investigation was to demonstrate tungsten and gold recovery from scheelite-bearing gold ores.
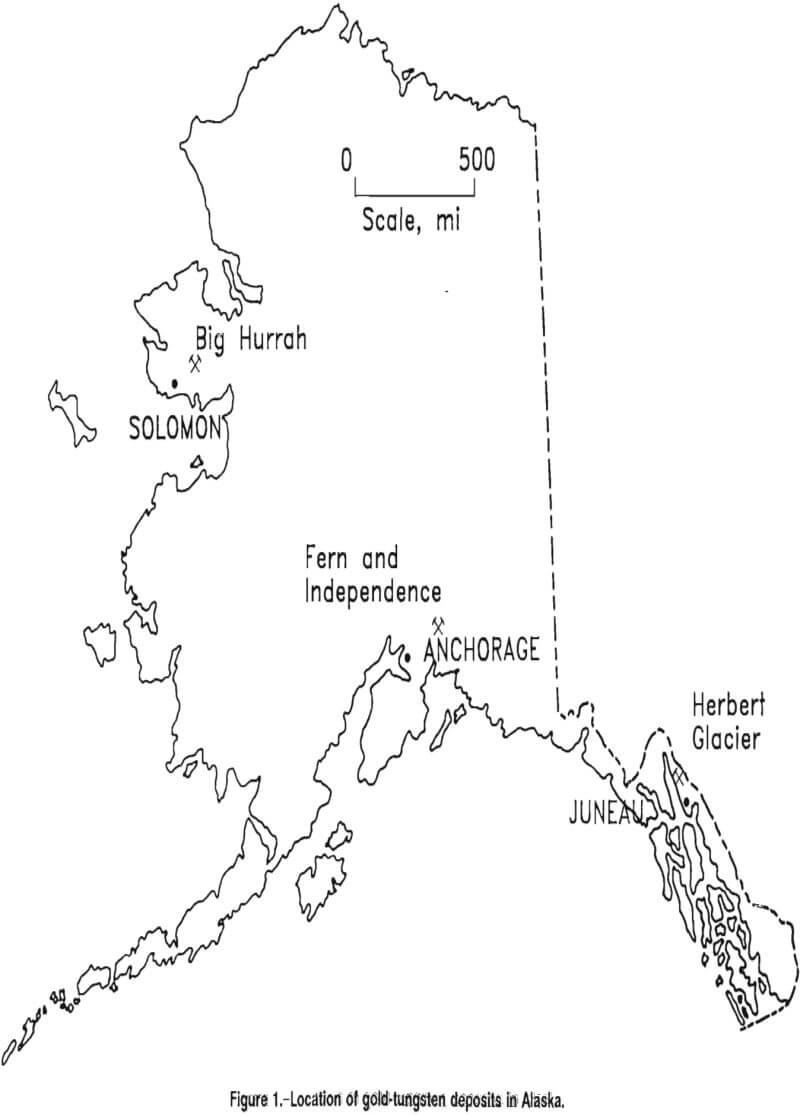
In Alaska, at least seven gold-tungsten deposits have been identified. One of these deposits, the Big Hurrah, is well defined, and deposits of its type may, in aggregate, contain significant resources of both tungsten and gold. Ore samples were obtained for this study from the Big Hurrah, Fern and Independence, and Herbert Glacier deposits (fig. 1). Other known Alaskan gold tungsten ores occur in the Bluff, California, and Flat deposits.
Sample Description
The first stage of the investigations was to characterize the samples in order to identify the most promising physical or chemical processing methods. Initial studies identified how the tungsten and gold were locked with the host rock and determined the particle size required for liberation of the tungsten and gold. To determine the liberation size, ore samples were examined with both optical and scanning electron microscopes.
Big Hurrah
The Big Hurrah deposit is located on the Seward Peninsula about 7 miles from Solomon. The total geologic reserves were estimated at 398,000 st, with 249,000 st considered to be surface minable. The material consists of massive and stockwork vein quartz in a siliceous graphite schist that contains thin layers of marble. Some quartz surfaces are thinly coated with carbonaceous material. Additionally, there are a very small number of inclusions and intergrowths of albite, arsenopyrite, pyrite, scheelite, and sericite in the quartz. Gold ore grades have been measured from 0.4 to 3.5 tr oz/st, and some silver occurs, mostly as electrum, at an average gold-to-silver ratio of 9:1. In the Big Hurrah, the tungsten and gold occur in a ribbon quartz vein. The sample evaluated in this report assayed at 0.9 tr oz/st Au and 0.17 pct WO3. Results of characterization studies showed the gold liberation size to be 150 mesh (105 µm). The scheelite liberation size was determined to be approximately 75 pct liberated at 150 mesh.
Fern and Independence
The Fern and Independence deposits are located in the Willow Creek mining district of Alaska, approximately 50 miles northeast of Anchorage.
The Fern sample consists of gold-bearing quartz vein material. The veins contains ankerite, calcite, and considerable clay, probably the result of weathering sericite. The veins are hosted by diorite and locally contain scheelite. The material received at the Bureau’s Salt Lake City Research Center assayed at 2.6 tr oz/st Au and 0.015 pct WO3. Microscopic examination of this material showed the liberation size to be 65 mesh (210 µm).
The Independence sample consists of mill tailings that contains up to 1.0 tr oz/st Au and 0.03 pct WO3. The mineralogy was similar to that of the Fern deposit. The liberation size of the Independence tailings sample was also found to be 65 mesh.
Herbert Glacier
The Herbert Glacier deposit is located 20 miles northwest of Juneau and consists of mineralized quartz-carbonate veins crosscutting a massive biotite gneiss. Vein mineralogy includes quartz and calcite with arsenopyrite, galena, scheelite, and sphalerite. Ankerite and sericite are common as alteration phases. Scheelite grades were found to be on the order of 0.03 pct WO3 in the as-received sample. Gold was present as discrete grains. High-grade vein samples have yielded assays of up to 7 tr oz/st Au. The liberation sizes were found to be 100 mesh (149 µm) for the gold and 200 mesh (74 µm) for the scheelite.
Tungsten and Gold Recovery Tests
The purpose of this investigation was to develop a flowsheet for recovery of tungsten and gold from ores of the type tested. The mineralogy of the ores suggested that gravity techniques might be successful in making an initial separation of scheelite and gold, and therefore, gravity concentration was investigated as a first step in the recovery process. The presence of sulfide minerals indicated that a bulk sulfide flotation might serve to recover associated gold values and also to clean the gravity concentrate for subsequent recovery of scheelite by techniques such as a second flotation procedure. Standard cyanidation procedures were designed for recovery of fine and locked gold from gravity and flotation tailings.
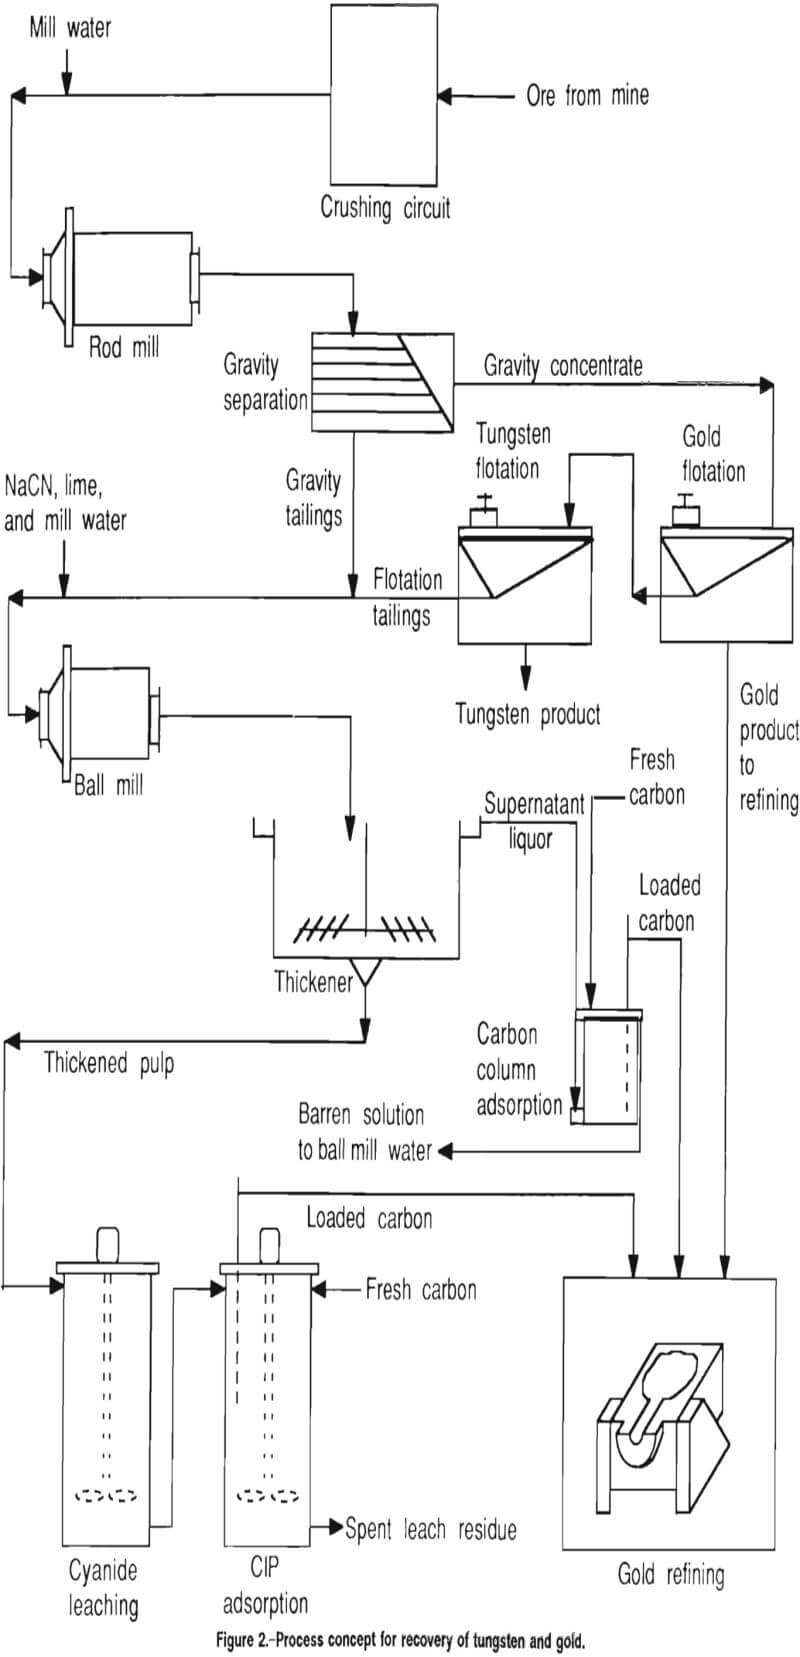
The process concept used in these studies is shown in figure 2. Ore from the mine is crushed in preparation for primary grinding in a rod mill to an optimum tungsten and gold liberation size. Following primary grinding, the material is gravity separated and the concentrate is treated in two flotation steps to recover gold and tungsten. A secondary grind is performed on the gravity and flotation tailings, after which the material is thickened in preparation for fine-grained gold recovery by cyanidation, carbon-in-pulp (CIP) adsorption, and refining.
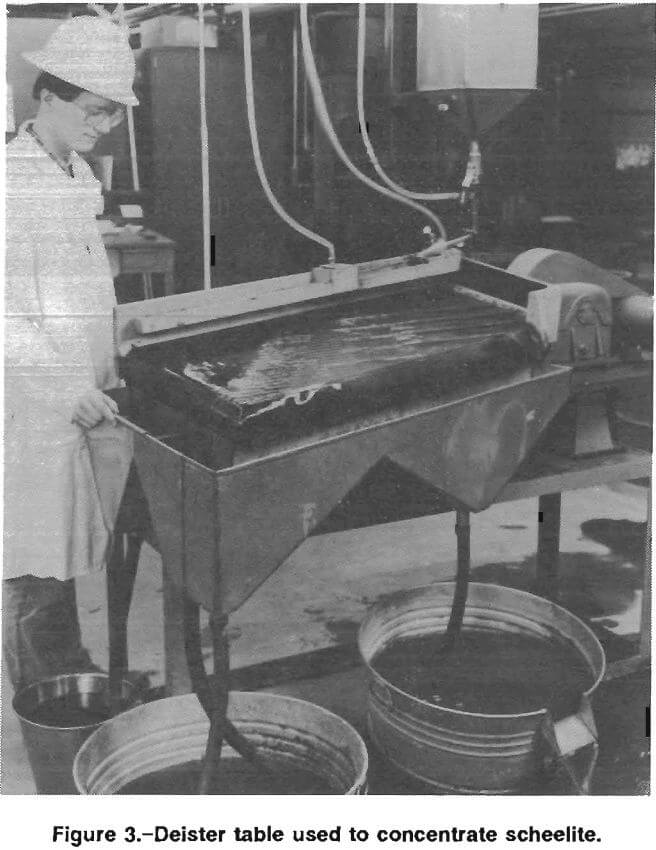
Several types of laboratory equipment and test procedures were used in this research. In some cases, the use of a particular type of machine was chosen for convenience. Other types could replace the equipment used in this research. For example, Deister tables were used in gravity concentration, but jigs, spirals, or other types of gravity concentrators may be alternative choices.
On all four samples, basic gravity tests were performed for concentration of the gold and scheelite, and cyanide leach tests were conducted. An assay screen analysis was carried out on one of the samples. One sample (Big Hurrah) was tested through a complete tungsten and gold recovery procedure. Equipment sizing and a mill design for this sample were based upon 1,000 st/d ore throughput.
Gravity Concentration
The four ore samples were subjected to a gravity tabling procedure in which the initial gravity products were concentrated twice. The purpose of the tests was to observe the behavior of the ore in the tradeoff of grade versus recovery for each additional concentration step. Each ore was prepared initially by charging minus 10-mesh material to a ball mill and grinding at 50 pct solids. Tungsten liberation was assumed to be optimum during gravity separation when a distinct band of scheelite was observed, with little scheelite appearing in the gravity tailings, while the material was being illuminated by ultraviolet light to make the scheelite fluorescent. If significant scheelite was seen in the tailings, the plus 325-mesh material was returned to the ball mill for further size reduction. Tests were done with a laboratory one-eighth-scale Deister table (fig. 3).
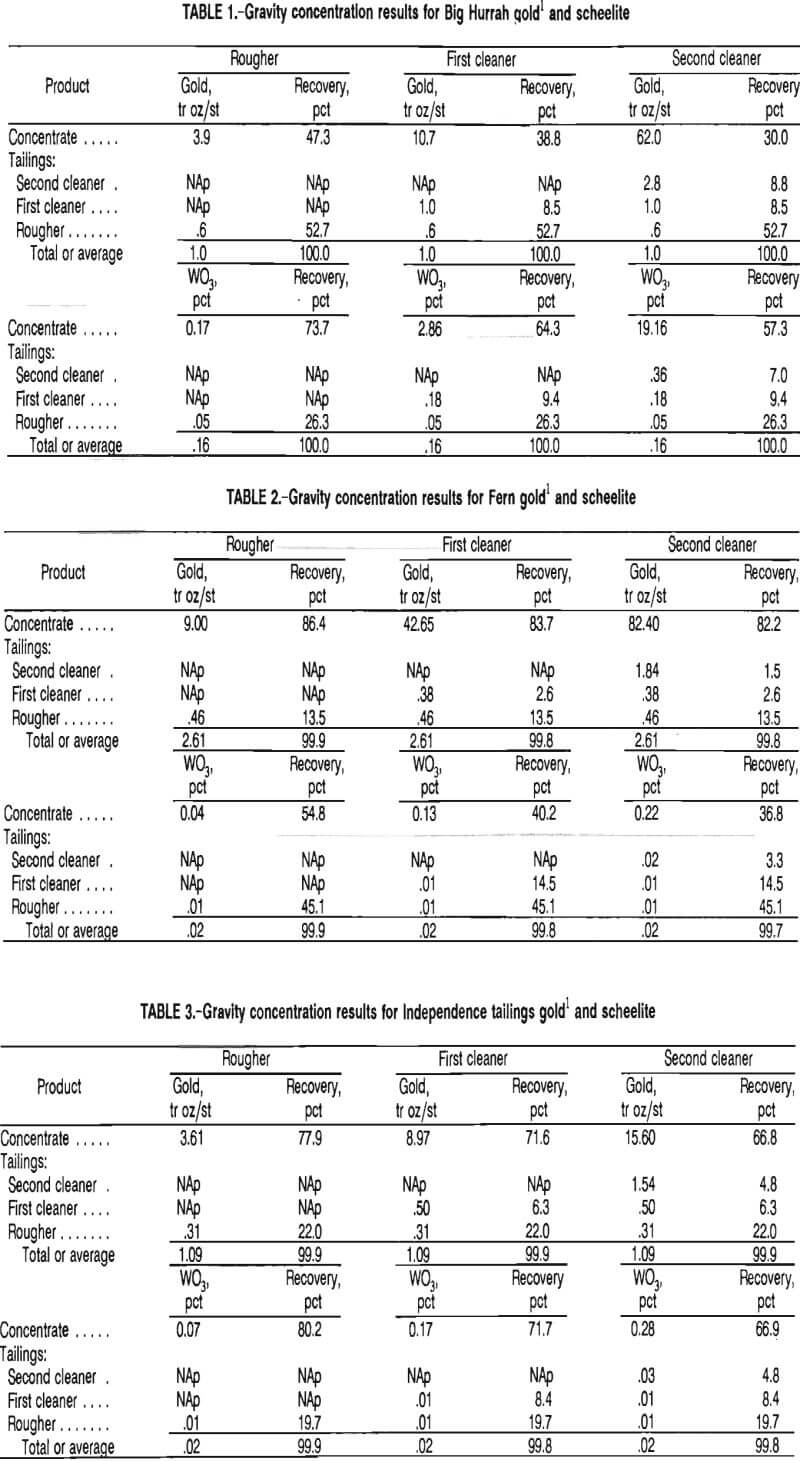
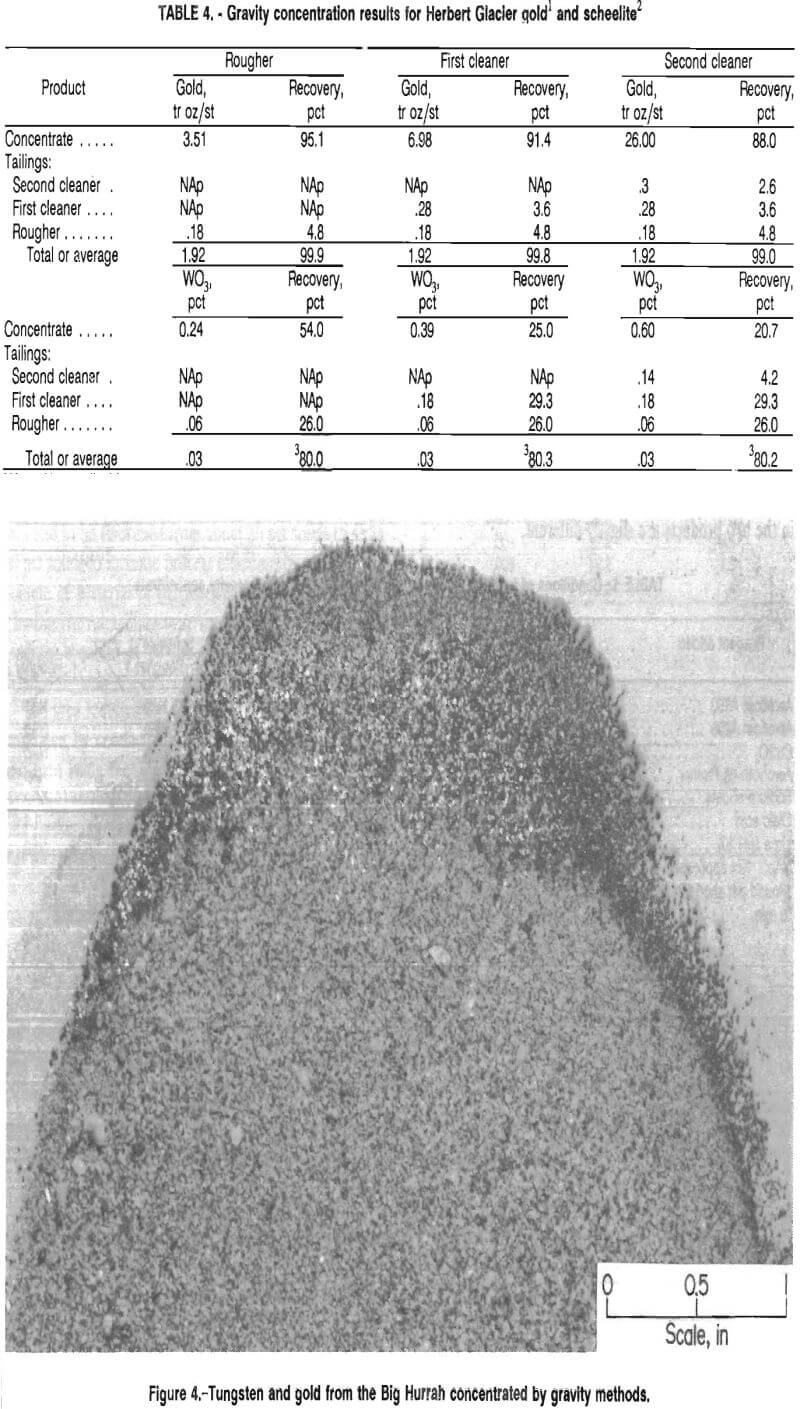
Typically in the gravity tests, the rougher step rejected about 85 pct of the total weight to the tailings; the first cleaner, about 12 pct; and the second cleaner, about 2 pct. This left 1 pct or less of the total weight of the mill feed as final concentrate. Results of tungsten and gold concentration and recovery from these tests are presented in tables 1 through 4.
The results for the Big Hurrah sample, presented in table 1, indicate that gravity was a successful means of concentrating both tungsten and gold. Although recovery of gold dropped from 47 pct in the rougher step to 30 pct after the second cleaner step, the gold reporting to the cleaner tailings was recovered by cyanidation along with the other 53 pct in the rougher tailings. The tradeoff of obtaining a lower initial gold recovery in this process was that a higher grade scheelite concentrate was obtained, in this case, 19.2 pct WO3.
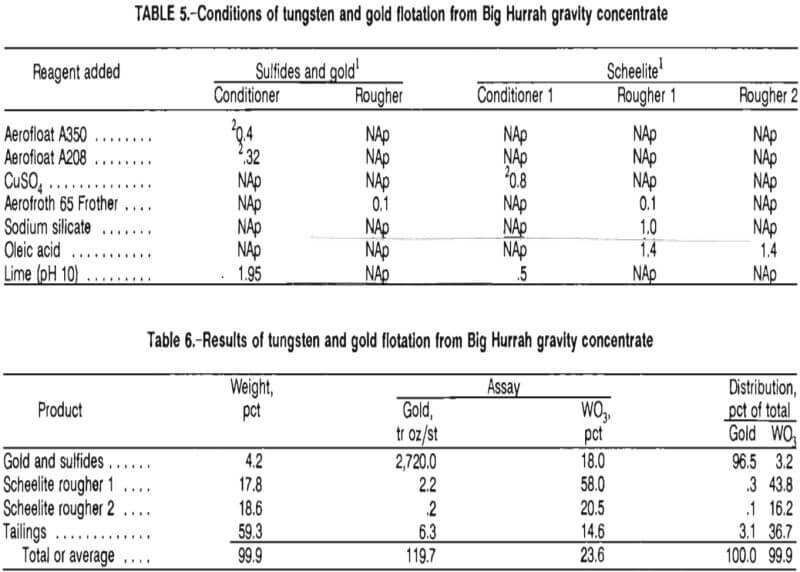
The scheelite product was further concentrated by froth flotation, which will be discussed later. Figure 4 shows a band of tungsten and gold from the Big Hurrah deposit that was recovered in the gravity concentrate. The scheelite is the white material within the dark band along the edge of the sample pictured. The sample was photographed in ultraviolet light.
The results for the Fern sample, as represented in table 2, show that gravity concentration was successful in achieving a high-grade gold product with a high recovery. The scheelite grade and recovery indicate that gravity concentration did not produce a suitable tungsten product.
The Independence tailings and Herbert Glacier samples exhibited gravity concentration behaviors similar to that of the Fern sample in that the grades and recoveries for the gold were viable but concentration of the scheelite was minimal by this means.
In the process concept, the gravity concentrate is treated by two flotation steps to recover gold and tungsten in separate concentrates, then the flotation and gravity tailings are combined and reground to liberate the fine-grained gold. Flotation of the gravity concentrate is discussed in the following section.
Flotation
Gold was recovered from Big Hurrah gravity concentrate by a bulk sulfide flotation using potassium amyl xanthate, Cyanamid Aerofloat A208 (sodium diethyl and sodium di-secondary butyl dithiophosphate) promoter, and a 3:1 mixture of methylisobutyl carbinol (MIBC) and Cyanamid Aerofroth 65 Frother (F-65). The sulfide float upgraded the gold from 119 to 2,720 tr oz/st with a recovery of 97 pct.
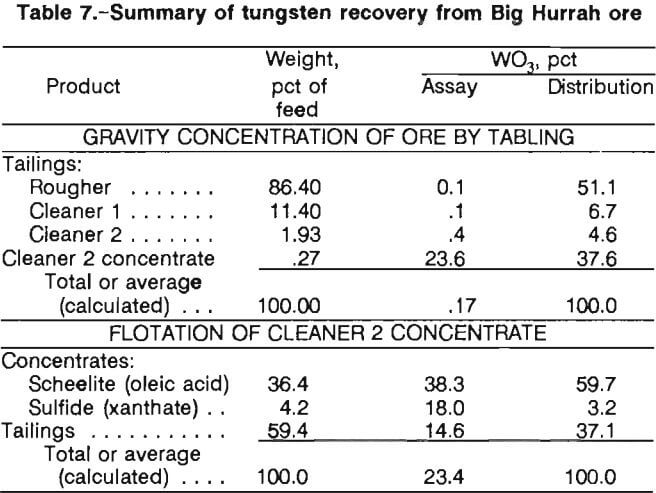
Tungsten was recovered from the sulfide flotation tailings by a fatty-acid float using copper sulfate as a promoter, lime as a modifier, sodium silicate as a dispersant, and 5 pct oleic acid in ethanol as a collector. The tungsten float upgraded the gravity-concentrated scheelite from 23.6 pct to a net 38.3 pct WO3 at a recovery of 60 pct. Tables 5 and 6 give conditions and results of the two-step flotation procedure. Gravity concentrate used in the flotation studies was produced from a larger scale separation, per-formed after the initial gravity tests reported in table 1 were completed; therefore, the scheelite and gold grades in the two products are slightly different.
As seen in table 6, grades as high as 58 pct WO3 were achieved by simple differential flotation, which approaches the grade of tungsten ore (65 pct WO3 minimum ) that is commercially sold. Combination of both rougher floats gives a net grade of 38.3 pct and a recovery of 60 pct from the gravity concentrate. Higher grades and recoveries should be obtainable by continuous cleaning and recycling steps. The test results presented in table 7 summarize the overall treatment of the scheelite and indicate that an acceptable tungsten product is recoverable. The flotation and gravity tailings, at this point, contained an appreciable amount of fine gold. These products were directed to the regrind mill for liberation of fine-grained gold prior to cyanidation.
After secondary grinding of the gravity and flotation tailings, the process concept calls for thickening the reground material prior to cyanidation.
Thickener Sizing Tests
Reground gravity and flotation tailings exiting the ball mill had to be thickened from about 30 pct solids to 45 to 50 pct solids to increase process efficiency by reducing the volume of material in the leaching and CIP procedures. The Big Hurrah tailings were reground with 5 lb/st NaCN (sodium cyanide) at 50 pct solids to 90 pct minus 150 mesh.
The area requirement for a conventional thickener was estimated by conducting batch-settling tests in cylinders and then using the Talmage-Fitch application of the Kynch settling theory. The area requirement for high-rate thickening was also estimated, using an Enviro-Clear test kit.
Batch-Settling Tests for Conventional Thickener
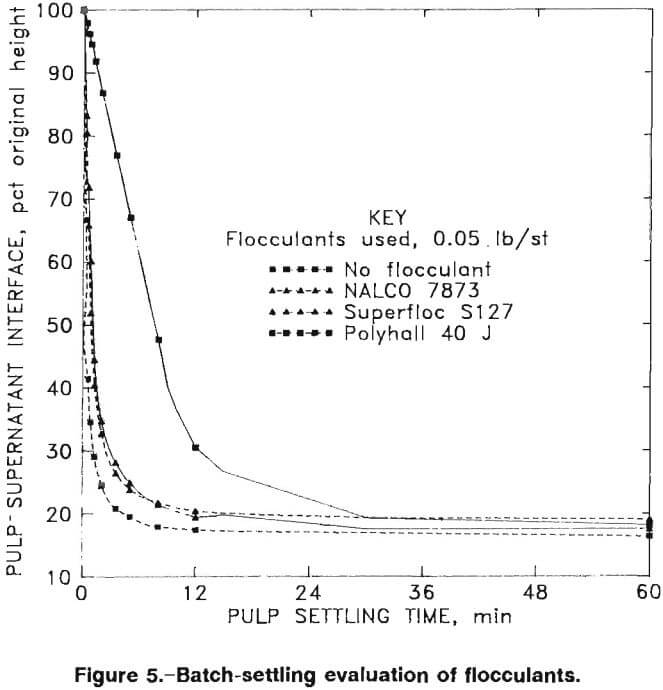
Initial settling tests showed that the untreated pulp settled too slowly at pH 10.3 (roughly the industry safety standard pH for cyanide operations) for thickener size estimation; therefore, 16 anionic, cationic, and nonionic flocculants were evaluated. Batch tests of the 30-pct-solids ball mill effluent were conducted in a 1,000-mL graduated cylinder.
The tests were performed by charging a cylinder with leach slurry and adding flocculant at a given concentration. The cylinder was inverted four times to allow the flocculant to mix into the slurry, then the interface height of clear fluid and mud was recorded at timed intervals during the settling process. Three of the flocculants tested built flocs (fine particles bound together by the flocculant molecules so that they behave as single larger particles) that settled at higher rates than the other tested samples. The three successful flocculants were Celanese Polyhall 40 J (0.0025 lb/st, highly anionic), Cyanamid Superfloc S127 (0.0017 lb/st, nonionic), and NALCO 7873 (0.0076 lb/st, moderately anionic).
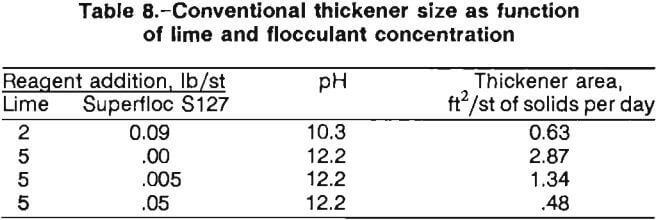
The supernatant in the tests at pH 10.3 was not totally clear, and therefore, the pH was raised. The settling tests were repeated at pH 12.2, which required 5 lb/st of lime, with and without the addition of 0.05 lb/st flocculants. Figure 5 presents results of pulp settling versus time results for tests with the three selected flocculants and with no flocculant.
The Talmage-Fitch application of the Kynch settling theory was used with the data presented in figure 5 to obtain thickener sizes corresponding to the compression zone of the batch-settled pulps. Table 8 summarizes the calculated required thickener areas using Superfloc S127.
High-Rate Thickener Sizing Tests
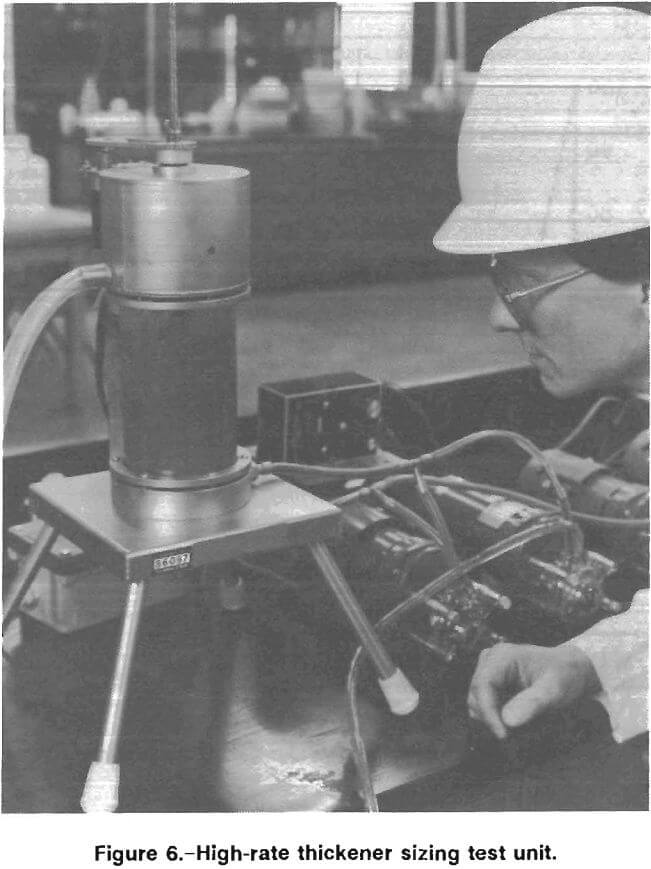
An Enviro-Clear high-rate thickener sizing test unit (fig. 6) was used to estimate the size of a high-rate thickener. Feed material for the test was prepared by cyanide leaching gravity tailings that had been reground at 50 pct solids to minus 200 mesh and diluted with cyanide solution to 30 pct solids. Feed and flocculant were mixed and fed into the thickener by metering pumps. The thickened solids were removed by a pump that was controlled by monitoring the pulp level. As the interface between solids and clear supernatant fluctuated, the underflow pump was started and stopped. The clear supernatant was removed by overflow.
Lime and flocculant concentrations used were 5 lb/st and 0.005 lb/st, respectively. The thickener feed was concentrated from 32 to 52 pct solids. The high-rate thickener size was found to be 0.48 ft²/st of solids per day, only 40 pct that of the conventional thickener at equivalent reagent concentrations.
The thickener overflow at this point contained dissolved gold and was to be directed to carbon adsorption columns, as shown in figure 2. No testing of carbon adsorption from clear supernatant overflow was conducted. The thickened underflow was directed to leach tanks, from which it proceeded to the CIP circuit for gold recovery.
Cyanide Amenability Tests
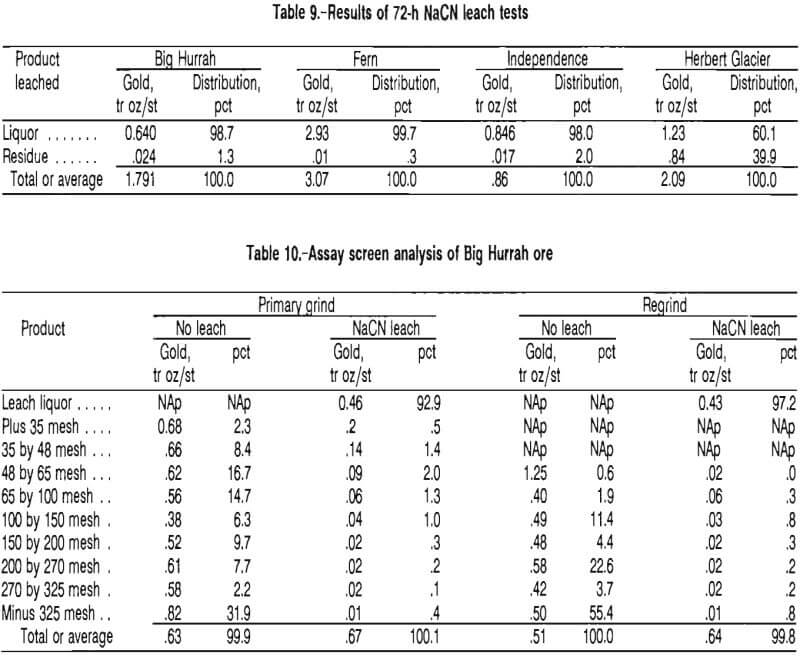
The first step in designing a leaching process was to estimate the gold recovery that could be achieved in a standard cyanidation procedure. Basic cyanide amenability tests were conducted on ore samples that had been ground to minus 200 mesh. The samples were leached in rolling bottles with 20 lb/st NaCN at 50 pct solids for 72 h. Table 9 gives the results. With the exception of the Herbert Glacier material, all ores were highly amenable to cyanidation.
The Herbert Glacier sample was also concentrated by flotation and pretreated with an oxidative pressure leach to prepare the material for cyanidation. The flotation procedure obtained a 30.5-tr oz/st concentrate at a 91.3-pct recovery, which compares closely with the gravity procedure (table 4) that achieved a 26.0-tr oz/st concentrate and an 88.0 pct recovery. Leach conditions of 220° C, 50 psi O2 overpressure, and 2 h were applied to the flotation concentrate. The pressure-leached concentrate was cyanide leached, and final gold recovery was 88 pet overall as compared with the 60.1-pct recovery in the untreated leach.
Figure 2 depicts the recommended basic flow scheme for the four samples tested, with the exception of the additional pressure leach of the Herbert Glacier material as it exits the gravity concentration step. Since gravity methods were unsuccessful in concentrating the scheelite in three of the samples, further work on recovering scheelite from the three samples was discontinued. The remainder of the gold recovery work was done on the Big Hurrah sample. The results of that work can act as a guideline for similar treatment of the other three deposits.
The second step in designing a leaching procedure was to determine the size to which the ore must be ground for effective gold extraction. Target ore grind was determined by a comparison of assay screen analyses of unleached and leached ore samples. Table 10 presents data from tests using samples of Big Hurrah ore that were ground to nominal minus 35 and minus 65 mesh (90 pct minus 150 mesh), representing primary rod mill grinding and ball mill regrinding, respectively. Gold content of ore in the cyanide-leached particles was reduced to 0.02 tr oz/st or less in both cases for the minus 150-mesh fraction; therefore, 150 mesh would be the target for regrinding the Big Hurrah tailings prior to cyanidation. The same tests were conducted with no leaching on minus 28-mesh gravity tailings and reground minus 65-mesh tailings, with similar results. The analysis presented in table 10 also shows that the gold content of the size fractions is relatively constant, and therefore no fraction can be rejected prior to cyanidation without an accompanying gold loss.
Further cyanide amenability tests with varying cyanide concentration and leach time were conducted on the Big Hurrah ore as a guideline to determine how the ore samples can be tested for response to cyanide leaching. Samples were agitated in rolling bottles during leaching.
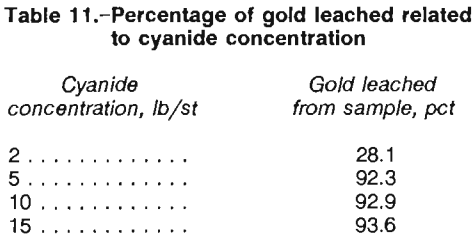
Cyanide Concentration
An optimal cyanide leach concentration was chosen on the basis of results from a series of five tests. Ore samples were agitated with 2, 5, 10, and 15 lb/st NaCN in rolling bottles for 72 h. As shown in table 11, gold extraction significantly increased between the 2- and 5-lb/st concentrations, but no significant increase was observed above the 5-lb/st strength.
One test was conducted with oxidized tailings to determine if cyanide consumption could be lowered by oxidizing the material before addition of cyanide. This material exhibited a slightly lower degree of consumption. The material was oxidized by agitating in a rolling bottle open to the air for 48 h, then leaching at 10 lb/st NaCN concurrently with a sample of untreated ore at equivalent cyanide reagent strength. The oxidized sample consumed 1.25 lb/st NaCN, whereas the unoxidized ore consumed 1.37 lb/st.
Leaching Time
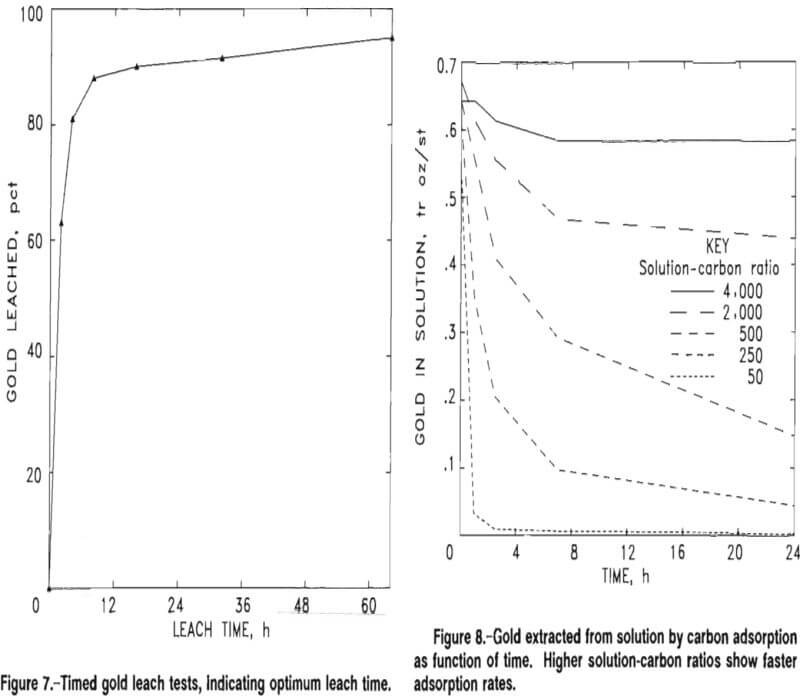
Reground gravity tailings thickened to 50 pct solids were leached in batches at the 5-lb/st cyanide reagent concentration established above for periods of 2 to 64 h.
Figure 7 shows that gold extraction leveled off at about 8 h. By taking into consideration the fact that leaching will continue throughout the CIP circuit, a leach design time of 8 to 12 h should be acceptable.
Bulk flotation of the cyanide leach residue showed that the lost gold was associated with either sulfides or carbonaceous material that concentrated with the sulfides. Testing was not conducted to determine if these losses were associated with the carbonaceous material found in the ore.
After cyanide leaching was completed, the gold was recovered from the leach solution by carbon adsorption in a CIP circuit.
Carbon-In-Pulp Gold Adsorption Tests
CIP extraction is used in many gold plants throughout the world and has the advantage of recovering gold from a slurry without countercurrent washing of the leached residue. CIP extraction operates by advancing the carbon countercurrent to the flow of the leached pulp. As the carbon advances from the gold-barren end of the CIP circuit toward the gold-rich end, the concentration of gold on the carbon increases.
The pulp flows by gravity from one stage to the next, and carbon is advanced countercurrent to the flow of pulp by airlift or recessed-impeller pumps, both of which cause minimal carbon attrition. The carbon is screened out of the slurry and advances to the next stage, and the slurry returns to the same stage from which it was removed and eventually leaves that stage by gravity flow. Once the carbon exits the CIP circuit, it is directed to a stripping circuit where the gold is usually removed by a hot caustic technique
Design of a CIP process requires (1) determination of kinetic and equilibrium data for loading gold from solution onto carbon and (2) a choice of an operating line. The design procedure will be explained in the following sections.
Batch Carbon-in-Pulp Tests
Kinetic and equilibrium data were determined by conducting five batch tests of CIP adsorption of gold on Big Hurrah tailings leach pulp samples at solution-to-carbon (W/M) ratios of 4,000:1, 2,000:1, 500:1, 250:1, and 50:1. The tests were carried out over a 24-h period, and samples of the solutions were taken at 0, 1, 2.5, 7, and 24 h and assayed by atomic absorption. Figure 8 represents the concentration drop of gold in the pulp over time for all five batch tests.
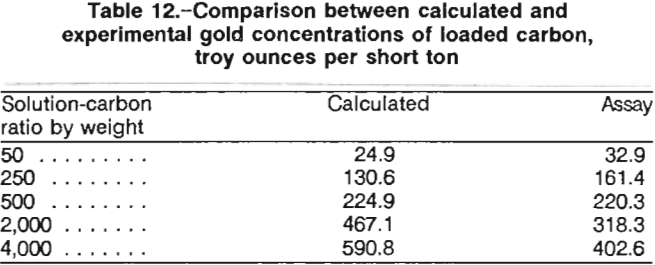
The concentrations of gold adsorbed onto the carbon were calculated from the solution concentrations. Evaporation losses and the losses due to sampling were taken into account for the calculations. At the end of the 24-h contact, the carbon was screened out, pulps were filtered and washed, and all products were fire assayed. Table 12 compares the calculated gold concentration on the carbon with the actual assay. Fire assay results from the five tests were important because they corroborated the data required to establish a calculated equilibrium curve in preparation for a staged carbon adsorption design.
Continuous Carbon-in-Pulp Tests
To corroborate the gold-on-carbon equilibrium conditions established by the batch tests, two continuous CIP tests were conducted with the slurry flowing through six stages with a fixed amount of carbon in each stage to contact the gold in solution. The first test was conducted until it was assumed that the first stage had loaded its carbon to equilibrium; the observation from the batch tests was that equilibrium was fully attainable after about 24 h. The second test was shut down after it was assumed that the first stage had dropped to less than 60 pct adsorption efficiency; the observation from the batch tests was that this drop in adsorption efficiency in the first stage would occur at about 5 h.
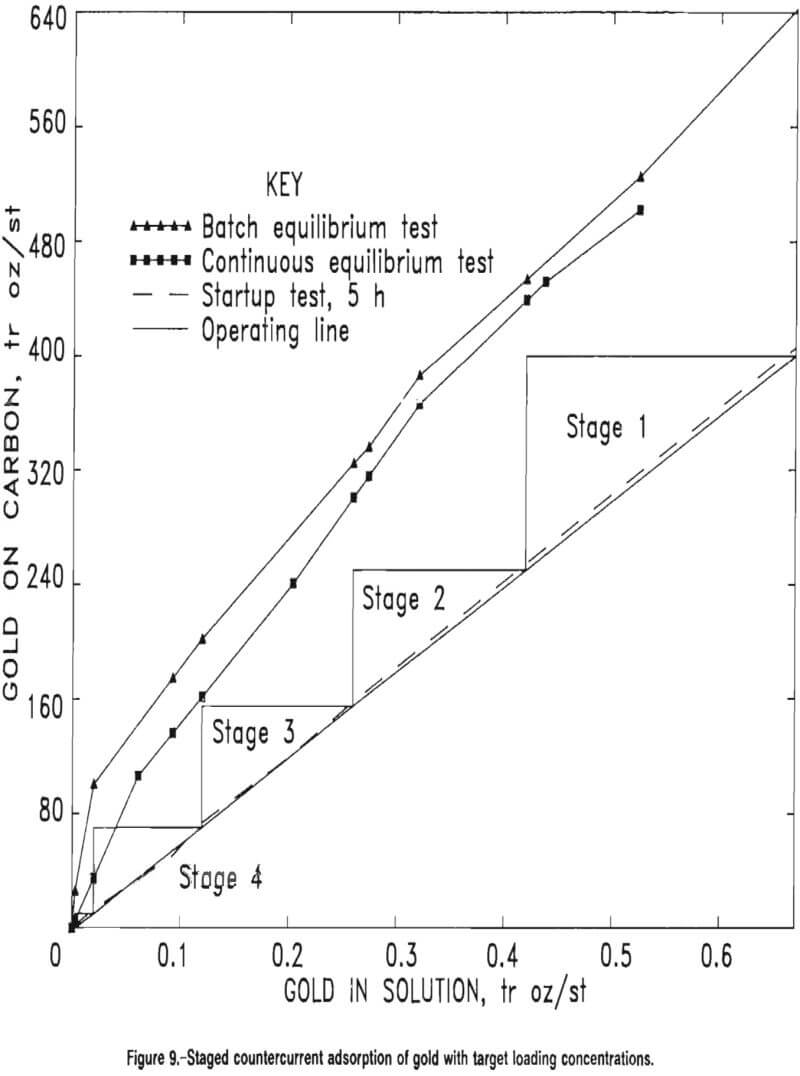
The equilibrium plot from the first test was expected to lie just below but parallel to the curve obtained in the batch CIP tests because longer contact time allowed the carbon in each stage to approach equilibrium with the solution flowing into that stage. The plot from the second test was to give guidance for choosing an operating line because, in practice, carbon normally will begin to be advanced in a continuous countercurrent flow once the first stage drops below this 60-pct adsorption efficiency. Figure 9 illustrates the corroboration between continuous and batch test data and also shows the choice of an operating line based upon the 5-h continuous startup test.
Based upon the data in figure 9 and the choice of target loading concentrations, the operating line equation was established by a target reduction of solution concentration from 0.6708 to 0.003 tr oz/st Au in solution. The slope of the operating line was found as follows:
W/M
= (final carbon loading) – (initial carbon loading)/(final solution concentration) – (initial solution concentration)
= (400-0) tr oz Au per short ton of carbon/(0.6708-0.003) tr oz Au per short ton of solution
= 599 st of solution per short ton of carbon……………………………………………(1)
Once an operating line was chosen, the next step was to design a CIP circuit to produce the target loading concentrations. The tailings from the CIP procedure typically assayed 0.038 tr oz/st Au.
Design of Carbon-in-Pulp Countercurrent Cascade
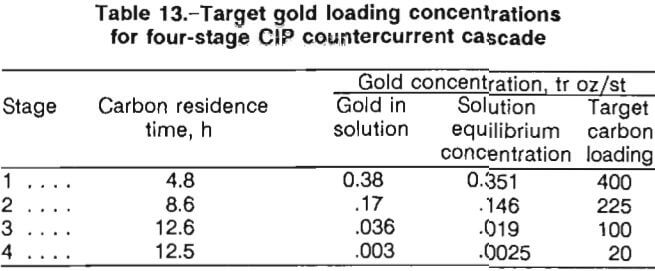
A four-stage CIP countercurrent cascade scheme was designed based upon the data represented in figures 8 and 9. Computation of the CIP residence times in each of the four stages was made by an established procedure that determines the mass-transfer coefficients that define the adsorption rate of the gold onto the carbon. Table 13 presents target loading concentrations for the four-stage CIP design. The target concentrations for the carbon on stages 1 through 4 are 400, 225, 100, and 20 tr oz/st Au on carbon, respectively. The staged operation is illustrated in figure 9.
Equipment Design for 1,000-st/d Mill for Tungsten and Gold Recovery
The test results presented above provided enough information to design a process flowsheet and to size most of the major equipment. The flow scheme developed from this study, based upon the Big Hurrah deposit, consists of gravity and flotation concentration of the scheelite and free gold, cyanidation of the gravity and flotation tailings, and carbon column and CIP recovery of the gold. The major equipment list is as follows:
- Hopper: 100 st capacity.
- Apron feeder: 48 in by 16 ft.
- Grizzly: 36 in.
- Jaw crusher: 42 by 48 in.
- Coarse ore storage: 16 by 16 ft (1,000 st live storage).
- Screen rod deck: 6 by 12 ft.
- Cone crushers (2): 7 ft standard and 5½ ft standard.
- Screen double deck: 8 by 20 ft.
- Vibrating feeders (8): 24 by 72 in each.
- Rod mill: 8 by 12 ft, 350 hp.
- Sumps (3): 6 by 6 by 8 ft each.
- Cyclones (2): 15 in each.
- Tables (3): 2, 40 st/h; 1, 15 st/h.
- Conditioner tanks (2): 5 min retention, 30 in diam by 6 ft each.
- Flotation cells (4): 24 ft³ each.
- Ball mill: 11½ by 10 ft, 1,200 hp.
- Thickener: either 45 ft diam (conventional) or 25 ft diam (high rate).
- Carbon adsorption columns (3): 30 in diam by 10 ft, 667 lb carbon each.
- NaCN leach tanks (3): 12-h retention, 20 ft diam by 24 ft each.
- CIP tanks (4): 12 ft diam by 18 ft each.
- Carbon wash screen.
- Carbon advance screens (4).
- Carbon safety screen.
- Carbon strip tanks (3): 40 in diam by 22 ft each.
- Strip solution tank and heater.
- Electrolytic cell: 96 ft³, 3.5 V, 350 A.
- Pregnant solution tank: 10 ft diam by 10 ft.
- Dore furnace and scrubber-mist collector.
- Acid wash tank: 40 in diam by 20 ft.
- Acid solution tank.
- Spent carbon tank: 12 by 12 by 12 ft.
- Carbon regeneration kiln.
- Reactivated carbon tank.
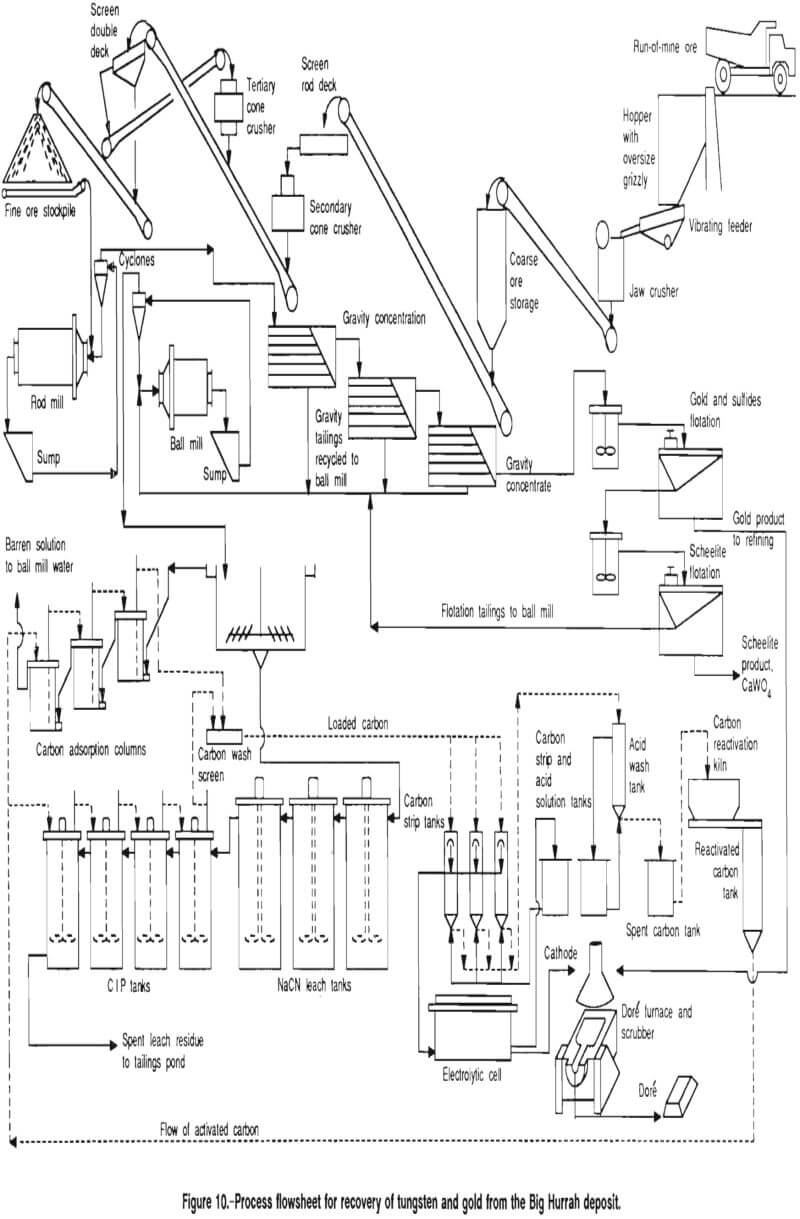
The flowsheet shown in figure 10 illustrates the proposed process. The following design criteria were used in developing the process and equipment requirements:
- The Bond mill grind work index for the ore, represented by the samples tested, was 16.9 kW·h/st and was used to size the grinding circuit.
- Ore grade to the mill will be 0.17 pct WO3 and 0.9 tr oz/st Au.
- Recovery will be 28 to 34 pct of the tungsten at 38 pct WO3 and 94 pct of the gold. The residue will contain 0.003 pct WO3 and 0.038 tr oz/st Au.
- Thickener size will be based upon a slurry pH of 12.2 (5 lb/st lime) and 0.05 lb/st flocculant; the diameter will be 45 ft for a conventional thickener or 25 ft for a high-rate thickener.
- Reagents will be consumed as follows:
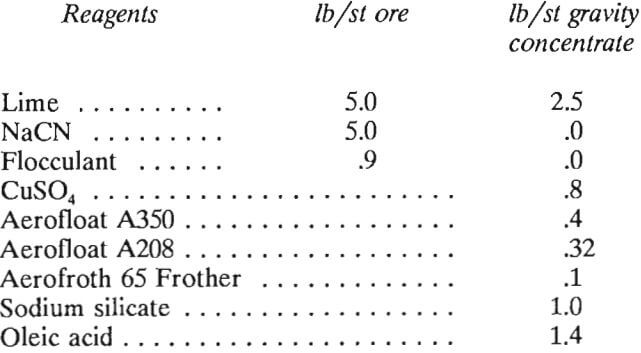
No assumption is made that recycled water from the tailings pond would contain any lime or cyanide in solution; therefore, the actual consumptions for lime and cyanide may be less than shown above.
6. The leach circuit will require 12 h of retention time (a 150 pct over-design factor) and a pulp density of 50 pct solids.
7. CIP adsorption will require a slurry flow of 79.8 st/h with 50 pet solids and a countercurrent carbon flow of 0.072 st/h. If the target gold concentrations from table 12 are desired in the design, then carbon amounts charged to each CIP stage will be 0.346, 0.619, 0.907, and 0.900 st for tanks 1 through 4, respectively. These amounts were calculated by the equation
Mi = M’ · tri………………………………………………………(2)
where M, is the weight of carbon required for the ith stage, M’ is the carbon flow rate, and tri is the calculated retention time for the ith stage.
8. Carbon stripping and reactivation will require about 1.6 st/d of carbon.
9. Electrowinning cells and a dore furnace are standard equipment and have been sized based upon experience.
Conclusions
- Results of laboratory studies showed that tungsten and gold can be effectively recovered from the Big Hurrah ore using a combination of gravity concentration, froth flotation, and cyanide leaching techniques. Tungsten recovery from three other ore samples was not successful by the gravity means tested. Concentrates from the minus 20-mesh ore were made by tabling, with tungsten recoveries ranging from 21 to 67 pet and gold recoveries ranging from 30 to 88 pct reporting to the gravity concentrate.
Tungsten and gold in the gravity product were separated and concentrated by a two-step flotation procedure. Tungsten flotation concentrate from the Big Hurrah deposit contained up to 38 pct WO3, with overall tungsten recoveries up to 34 pct. Gold flotation concentrate contained approximately 2,720 tr oz/st Au and was a suitable material for direct feed to a smelter. - A procedure was developed for recovering gold in the table and flotation tailings by regrinding to minus 150 mesh, cyanide leaching, and CIP adsorption with loadings of up to 400 tr oz/st Au on the loaded carbon. Total gold recovery in the flotation concentrate plus loaded carbon was approximately 94 pct.
- Sufficient data were obtained from this study to develop a flowsheet for tungsten and gold recovery for one sample with the design parameters to size most of the major equipment required. Data were also obtained from this study to indicate a flow scheme for gold recovery of the other three tested samples.
- Techniques developed in this study should be applicable for designing laboratory gold recovery tests and developing process flowsheets for similar ores.