
Table of Contents
In recent years interest in hydrometallurgy, particularly in the case of in-situ leaching and solution mining has remained at a high level. There are several studies published on the development of scale-up principles. D’Andrea and Runke described research on in-situ copper leaching at the Emerald Isle Mine whose dominant copper mineral is chrysocolla. The program was directed to develop in-situ leaching methods for 200,000 tons of ore exposed in a pit bottom and also 1,500,000 tons of ore under 200 feet of overburden adjacent to the pit. Ito described the problems involved in the application of an in-place leaching technique in Japan. Ranchers Exploration published results for the in-situ copper leaching at Old Reliable (4,000,000 tons of mixed oxide-sulfide ore) and Big Mike Mine (475,000 tons of mixed ore). In each case, the effort was similar in nature, a full scale experimental trial. Lewis et al have made an economic analysis of the in-situ extraction of copper, gold and uranium. The extraction technology and economics for these metals have much in common.
Modeling is a mathematical tool that attempts to explain all phenomena in terms of the associated physics and chemistry. Modeling from first principles alone is certainly a worthy goal for the long term but is not totally realistic at the present time because of the complexity of solution mining systems and the lack of fundamental data. Attempts to relate laboratory results to field conditions has met with some degree of success. Grimes developed a penetration model to predict uranium extraction rates in underground bacterial leaching of an as blasted ore. The model is based upon the hypothesis that extraction is directly proportional to the volume of a piece of ore that is penetrated by the leaching agent, and that each piece of ore, regardless of size, has been penetrated radially from external surface to the same depth at a given leaching time. The modeling of leach dumps and in-situ systems of low grade copper sulfides has received much attention. A physicochemical model based upon the continuity equation for oxygen in spherical coordinates was developed by Bartlett and examined for leaching of copper sulfide ores. A reaction zone model introduced by Braun et al has been successfully applied to primary copper sulfide ores and more recently to secondary copper sulfides. The same type of model was applied to a kinetic study of the acid leaching of chrysocolla. A modified steady-state approximation of the continuity equation has been applied by Madsen and Wadsworth to the leaching of enriched copper sulfide ores.
The modeling of the leaching of copper oxide ores has not received as much attention as sulfide heap leaching. The acid leaching of copper oxide ores generates a vertical acid concentration gradient in the ore heap, which is not generally observed in sulfide deposits. Shafer et al have verified Roman’s model and were able to predict the leaching behavior for a relatively large scale column test on coarse ore. However, the model has limitations with respect to acid consumption predictions. More recently a diffusion model was incorporated with a maximum gradient, plug flow model to estimate acid consumption and its subsequent influence on leaching kinetics.
The object of this work is to refine the maximum gradient model with phenomenological concepts drawn reasonably from the experimental data. A mathematical formulation is derived from a consideration of the material balance and simplified for copper oxide leaching on the basis of phenomenological concepts. The leaching behavior of the copper oxide ores is analyzed according to the semi-empirical model employed in this study. The application of the maximum gradient model is confined to laboratory results only in this study. Hopefully the analysis provides an adequate basis for extension to field in-situ conditions.
Experimental
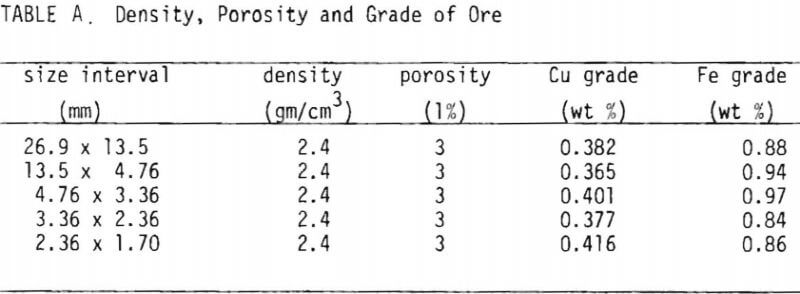
The copper oxide ore used in this study was supplied by Occidental Minerals Corporation from their Cerrillos property near Santa Fe, New Mexico, and was in the form of broken core samples consisting of chunks averaging four inches in diameter. A mineralogical report indicated that the sample contained predominantly neotocite (Fe, Mn, Cu) SiO3 as blebs and specks on fracture surfaces, and brochantite CuSO4.3Cu(OH)2 was present in lesser amounts as crystals and masses on fracture surfaces, along with traces of finely disseminated copper pitch. The presence of copper in a predominantly manganese-iron precipitate was noted using emission spectroscopy. Table I summarizes the results of porosity tests and assays.
The material was crushed and screened into the size fractions used and referred to in each of the experiments. The experiments were carried out with mono-sized material in small diameter columns. Glass tubes, 4.1 cm diameter by 45 cm long and PVC tubes, 5.5 cm diameter by 122 cm long were used for the percolation leach experiments. Figure 1 illustrates the systems used in these leaching tests. Reagent grade sulfuric acid was used to make a solution of desired acidity. The solution in a reservoir was pumped into a constant head tank, which was used to guarantee a constant flow rate. The solution was distributed at the tops of the
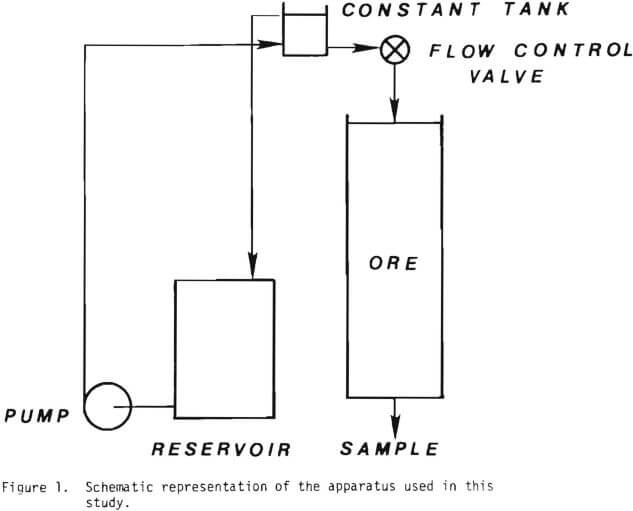
columns with a glass wool pad. The volume of the solution collected at the bottom of the column was measured, sampled and assayed for various time intervals. At the conclusion of each experiment the ore was drained and a sample taken for total copper. A Perkin-Elmer model 305 atomic absorption spectrophotometer was used for analysis.
Batch tests were carried out using a 0.5 l round bottom flask provided with stirrer and fritted glass sampler. Approximately 25 g of ore were added to 0.3 l of solution. Agitation was not sufficient to suspend the course particles but was that needed to pump the solution freely through the bed of coarse particles resting on the flask bottom. Results indicated the agitation was sufficient to eliminate interparticle diffusion as rate limiting thus providing particle reaction kinetics for subsequent use in the general model. Solution samples of 10 cm³ were removed at regular intervals for solution analysis.
Mathematical Formulation
A general model based upon the equation of continuity for mass transport, incorporating intrinsic kinetic parameters, was developed. For a cylindrical column of cross sectional area A and of length L, assuming plug flow, the lixiviant balance consideration yields
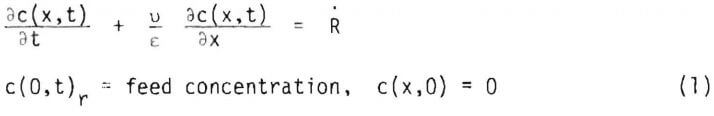
where u and are solution velocity and fractional void space respectively, R is net rate of generation of lixiviant per volume of liquid, and x is the distance measured from the top of the column. Assuming spherical ore particles, the rate of diffusion of lixiviant within an ore particle at position r may be given by

where : is the geometry factor and D is the diffusivity of the lixiviant through the pore space of the particle, which may be allowed to vary. From consideration of the lixiviant balance in spherical coordinates the lixiviant concentration profile c(x,r,t) in an ore particle may be expected to satisfy the equations
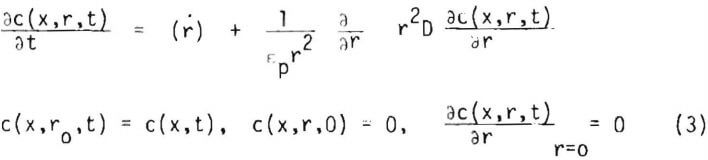
where cp is the porosity of the ore particle and (r) is the net rate of generation of the lixiviant per volume of liquid in the ore particle.
The term R may be related to n by
R = nd + (other terms)……………………………………………………………..(4)
where d is number density of the ore particles of radius ro in the column and (other terms) include net lixiviant generation outside or at the surface of the ore particles; for instance, the effect of salt precipitation and/or dissolution if any. For a narrow ith size fraction in a broad particle size distribution, equations (3) for c(x,r1,t) with c(x,r10 ,t) = c(x,t) are coupled with equation (1) through R = Σ1h1d + (other terms). In principle, the concentration profile within the column and ore particles may be obtained. In the case of copper oxide leaching, the lixiviant is hydrogen ion. Copper recovery can then be calculated from the knowledge of the stoichiometry; i.e. moles of copper releated for each mole of hydrogen ion consumed.
A shrinking core model was applied in this analysis to examine the validity of the general formulation applied to copper oxide leaching. Essentially the model involves quasi-steady state diffusion of the lixiviant through the previously reacted portion of the ore particles, followed by chemical reaction at the surface of the unreacted core. Mathematically this model may be identified with the reaction zone model proposed by Braun et. al. Since small size fractions of ore have been used for this study the surface reaction term may not be negligible compared to the diffusion component. Models involving diffusion only have been used by several investigators to explain the leaching behavior of oxide ores in columns.
Assuming quasi steady state, equation (2) may be integrated with respect to distance only, to yield (c(x,t)=c(x,r10,t))
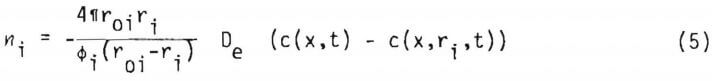
where De is effective diffusivity of the lixiviant through the reacted shell of the particle. The effective diffusivity is related to the porosity of the reacted portion of solid and the tortuosity, 1, by the
equation De = DEp/T.
If the chemical reaction at the surface at radius ri is assumed to be first order, ni may be expressed as
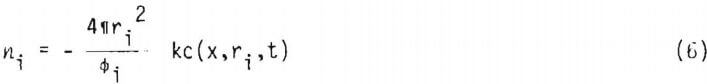
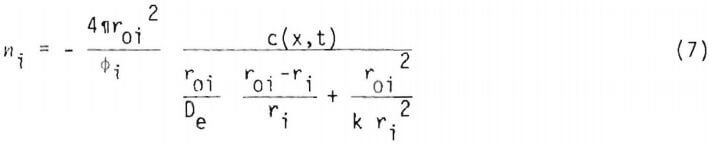
where k is the reaction rate constant. Eliminating c(x,r1,t) from (5) gives
The number of moles of copper in an ore particle or radius r1 is
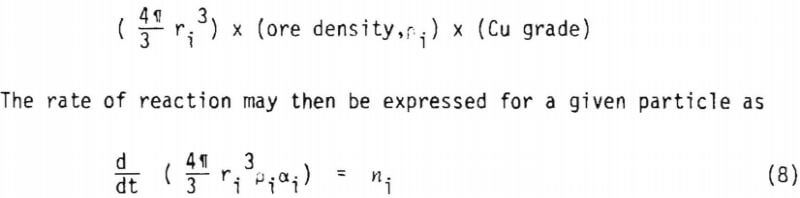
where u = (Cu grade) x (stoichiometry factor). It is useful to express the rate in terms of fraction reacted, a1(x,t). For a given particle of initial radius r10.
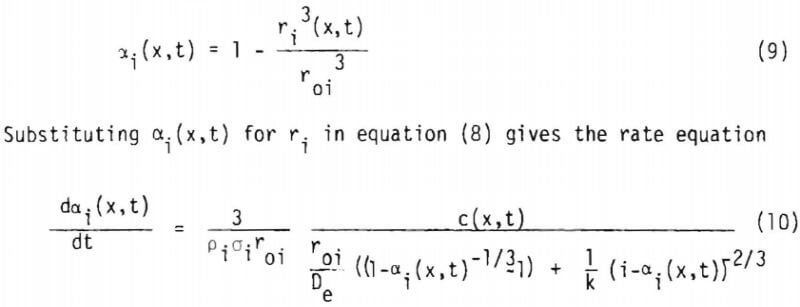
where a1 includes the geometry factor. Equation (10) is coupled with equation (1) through equation (4) to give a1(x,t) and c(x,t). Since equation (10) is derived from the shrinking core model (or the reaction zone model) there must be no lixiviant consumption in the reacted portion of the ore particle. In the study of copper oxide leaching, the consumption of acid is too high to be explained by copper release alone, particularly in the later stages of leaching. An independent term due to gangue materials has, therefore, to be taken into account for R, the net rate of generation of acid in the column. In this investigation R is represented by three different constants corresponding to the three stages of leaching, which will be described in the following section. Equation (1) may then be written as
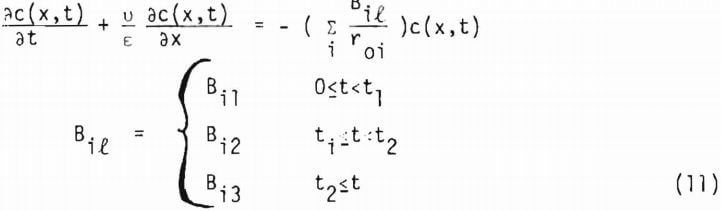
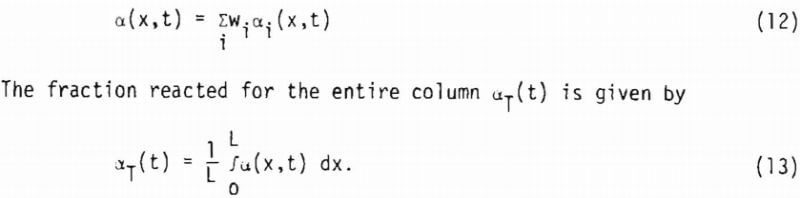
In general t1 and t2 depend upon the sizes i. For a multi-particle sized ore Bil includes the weight fraction wi of the size i. Total fraction reacted a(x,t) at x is given by
Results and Discussion
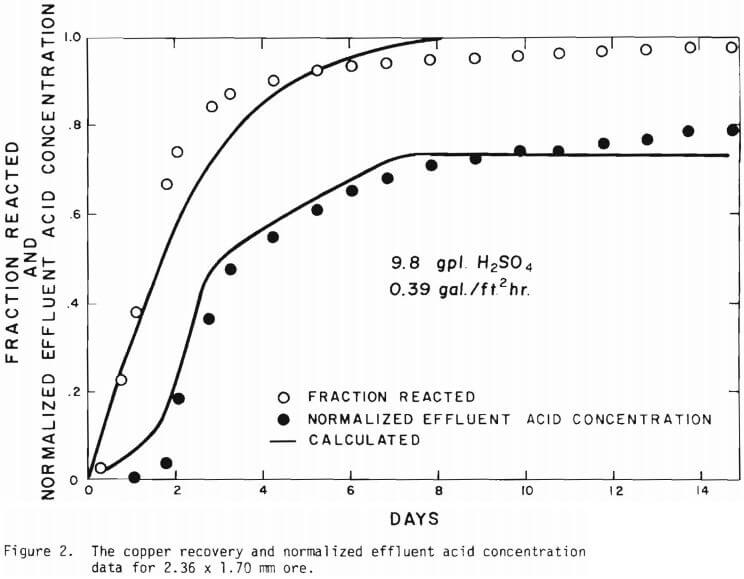
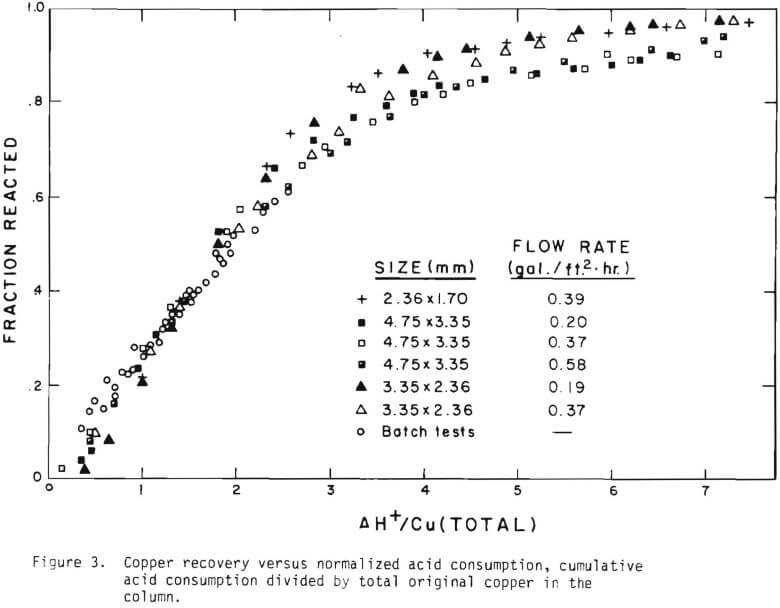
The overall behavior of copper oxide leaching is revealed in Figures 2 and 3. As seen in Figure 2 the effluent hydrogen ion concentration reaches a certain fraction of the feed concentration in several days of leaching and varies slowly afterward. The acid is consumed continuously even after leaching most of the copper. Figure 3 is a plot of copper recovery represented by fraction reacted of an ore particle versus a “normalized” hydrogen ion consumption. Normalized is defined as the cumulative amount of hydrogen ion consumed divided by the total original amount of copper in the column. As seen in Figure 3, within experimental error, a linear relationship between copper recovery and acid consumption can be stated as a characteristic of leaching behavior. The deviation from linearity may be ascribed mostly to the gangue materials consuming acid independently from copper minerals. Coarser materials may be expected to consume more acid for the same degree of copper recovery. From the linear relationship the stoichiometry factor of 3.9 on a mole basis is indicated.
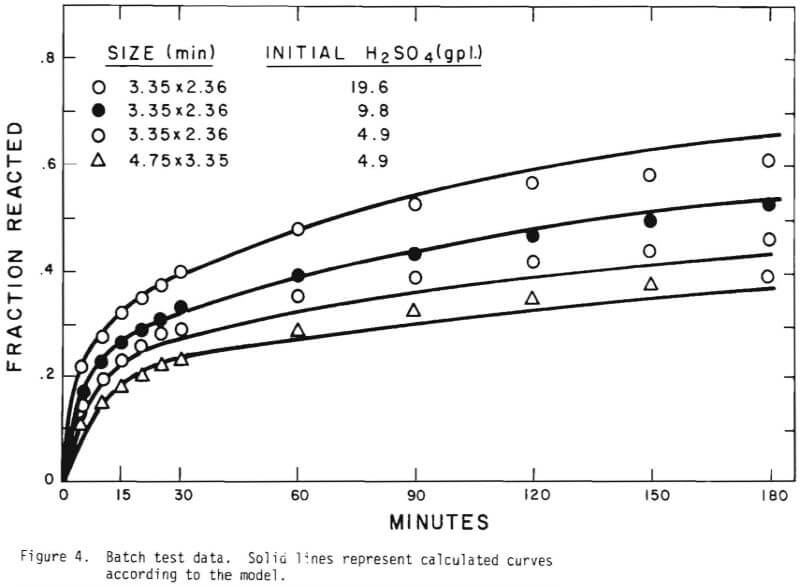
In order to investigate ore particle kinetics for the leaching, batch tests were conducted for different initial acid concentrations. The acidity was allowed to vary in the process of leaching. The study of the batch tests suggested the following mechanism of the leaching behavior;
- flushing of the ore surfaces with the highest rate of acid consumption,
- penetration of acid to react with copper mineral and gangue constituents,
- slow acid consumption mostly by gangue materials. Figure 4 shows the results of the batch tests.
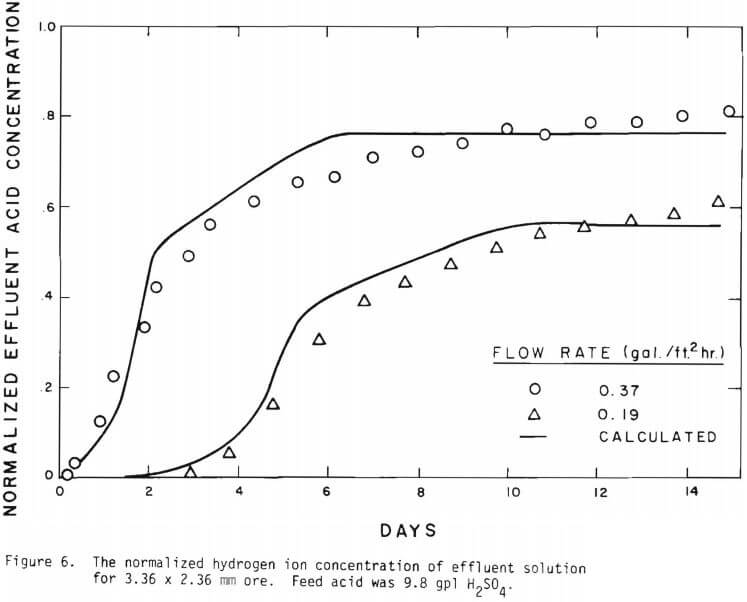
Solid lines are calculated on the basis of the leaching mechanism described above. The effective diffusivity of 1.19 x 10 -7 cm²/sec and the surface reaction rate constant of 1.11 x 10 4 cm/sec were determined. As seen in Figure 5 the logarithm of normalized hydrogen ion concentration (pH – initial pH) can be represented by two different slopes within the period of time considered. The normalized effluent hydrogen ion concentration for slow systems are shown in Figures 2, 6, 7, and 8. The concentrations can also be represented by
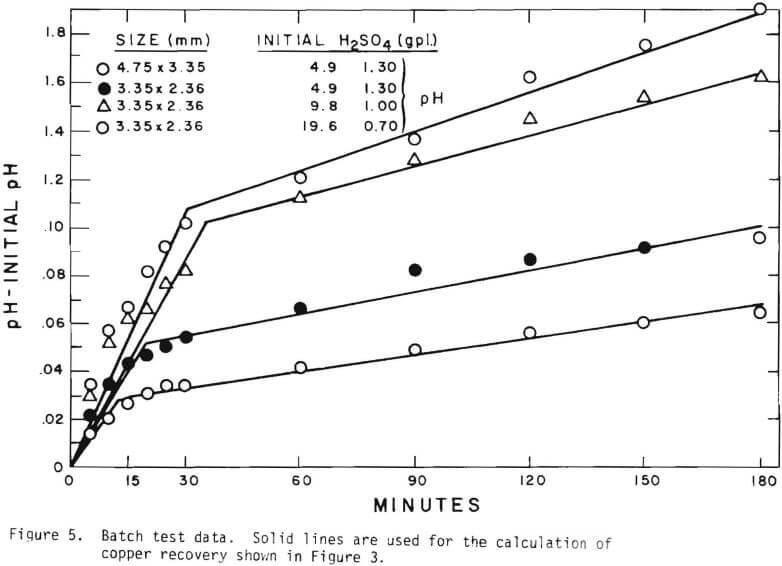
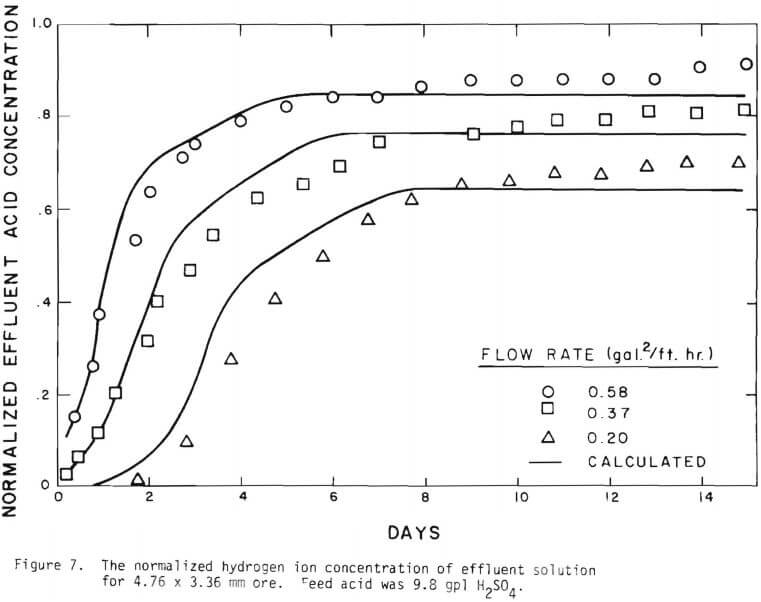
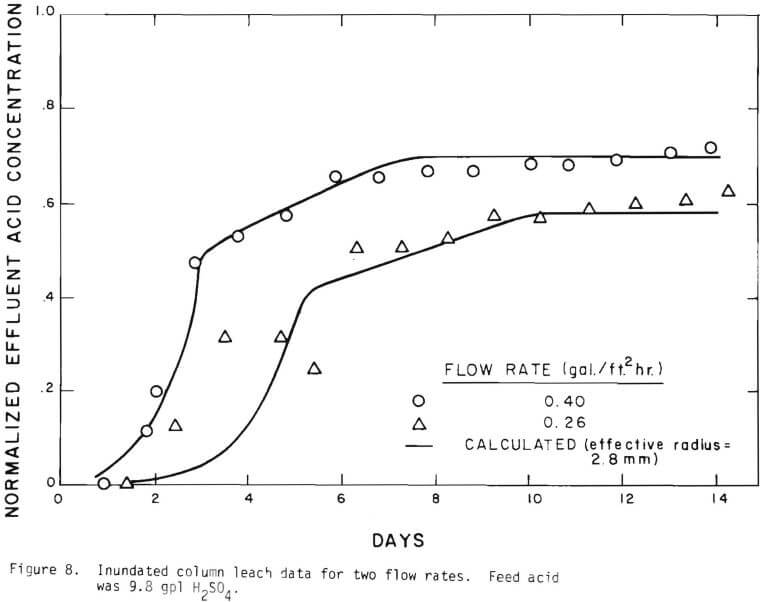
three lines, which may correspond to the three stages respectively. Because of the gangue constituents the first two constants may not precisely correspond to the first two stages respectively. There may be two types of gangue consuming acid. One can be treated independently from copper mineral. This is mainly responsible for acid consumption in later stages of leaching. The other is associated with the oxidized copper minerals.
The behavior of the acid consumption, which may be described by the three stages, may be noted in Figure 3. In the batch tests the third stage was not reached, as is evident in the figure. Equation (11) was the result of introducing these three numbers.
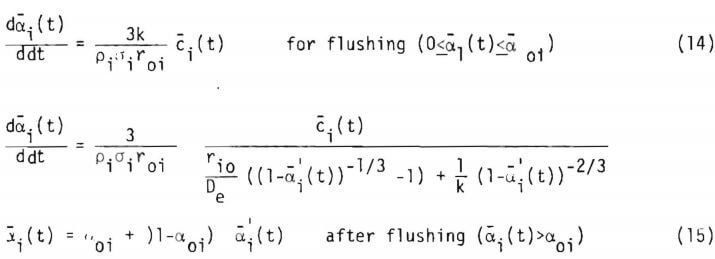
The column is arbitrarily divided into increments. Since the same equations given in (10) and (11) hold for every increment, equation (11) is solved assuming an average concentration c1(t) over the increment. The average concentration is then used to obtain average fraction reacted a1(t) over the increment from equation (10). Introducing the flushing stage the rate equation handled in this study is expressed as, for each increment
Further details in the computation are described in Appendix A.
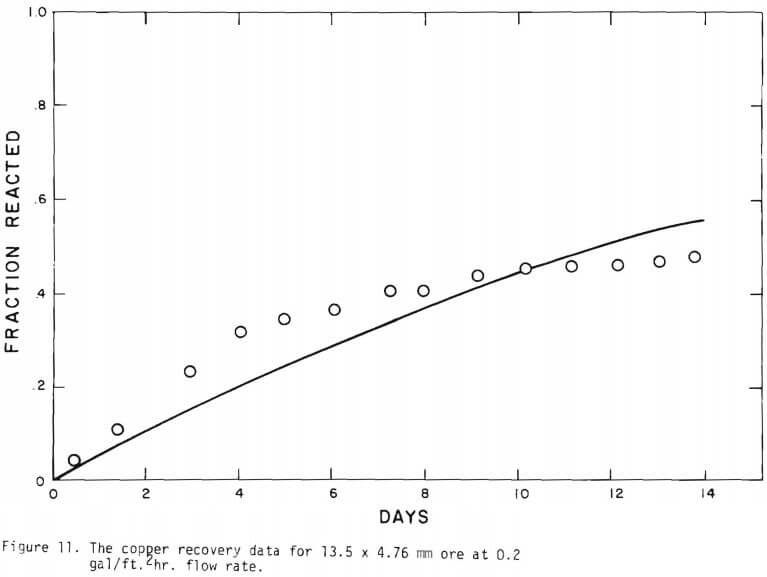
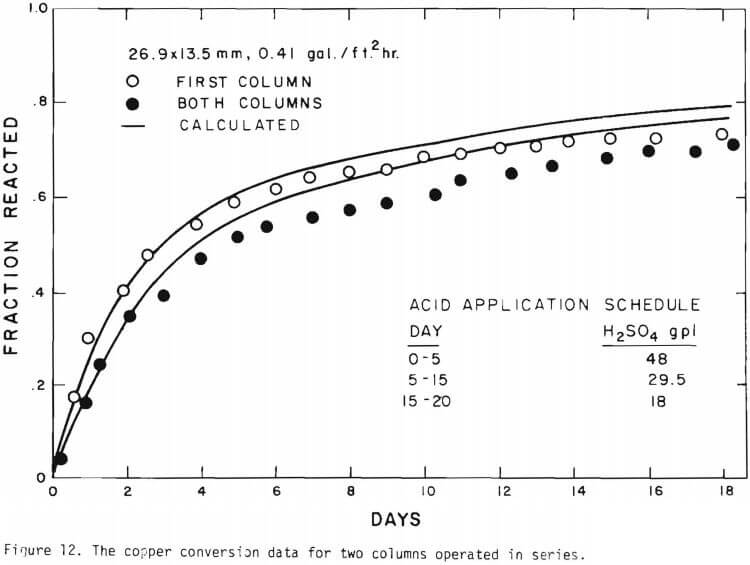
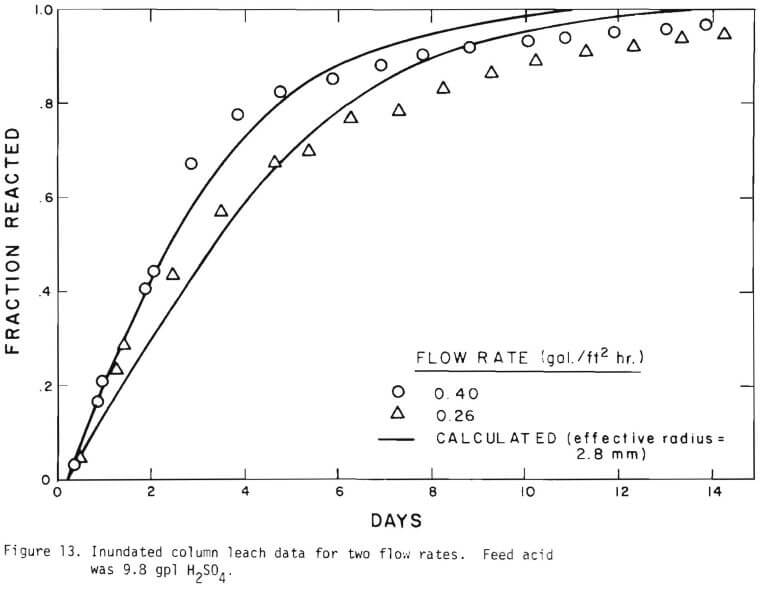
It is noted that there is large difference in the rate between the flow system and the batch system. This difference may be ascribed to the channeling of the lixiviant resulting in; (a) different effective surface area, and (b) different effective initial size of the ore due to clustering and by-pass. The solid lines in Figures 6 through 13 are calculated from equations (11), (14) and (15) with (a) and (b) taken into account. An α01 value of 0.16 and k of 0.49 cm/day were estimated from the data obtained
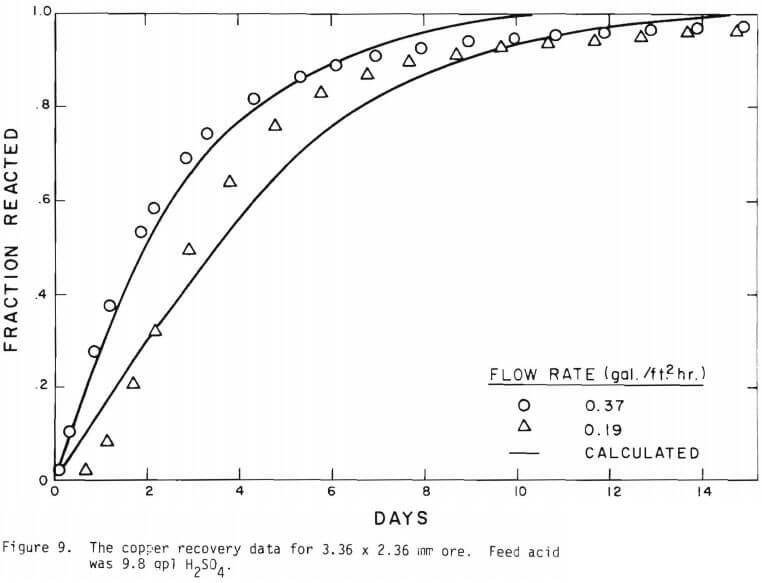
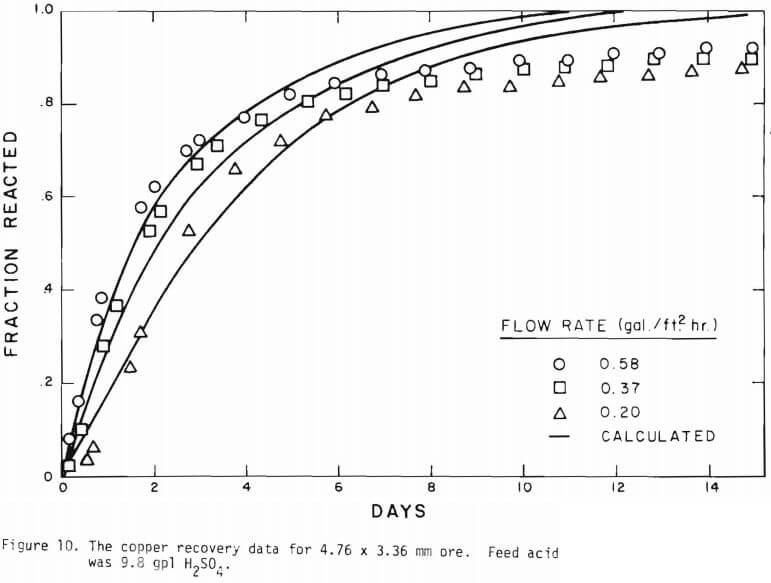
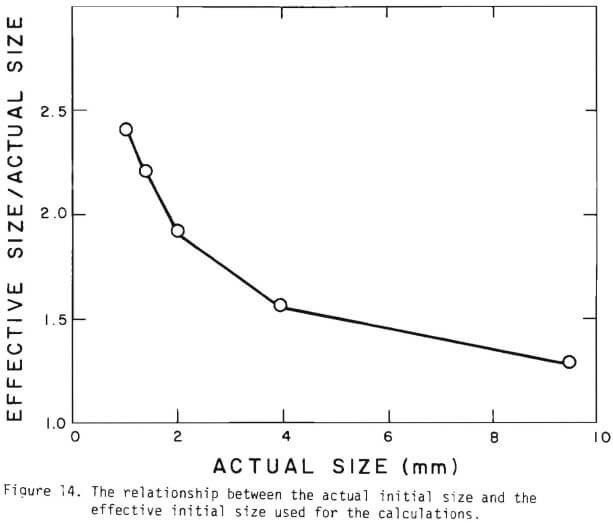
for the 3.35 x 2.36 mm ore. The same thickness (r10 r1) for a10 = 0.16 from the 3.35 x 2.36 mm ore was used to estimate a10 of other sizes.
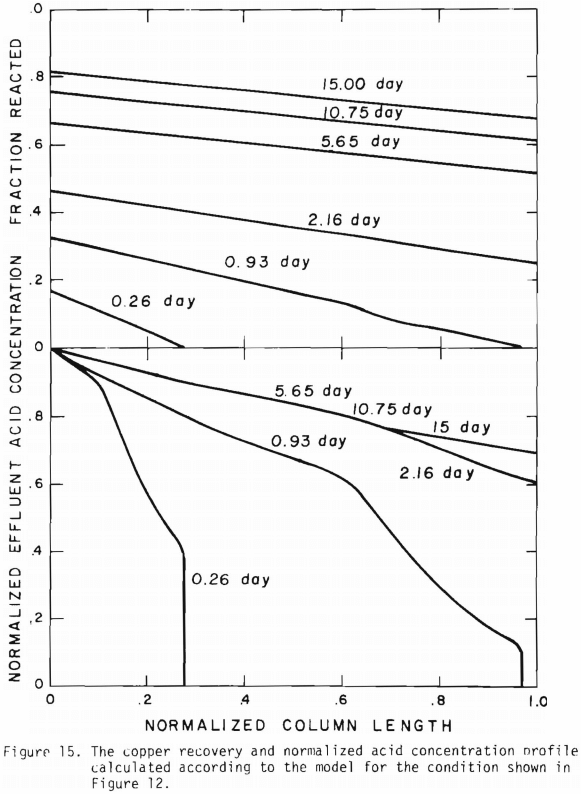
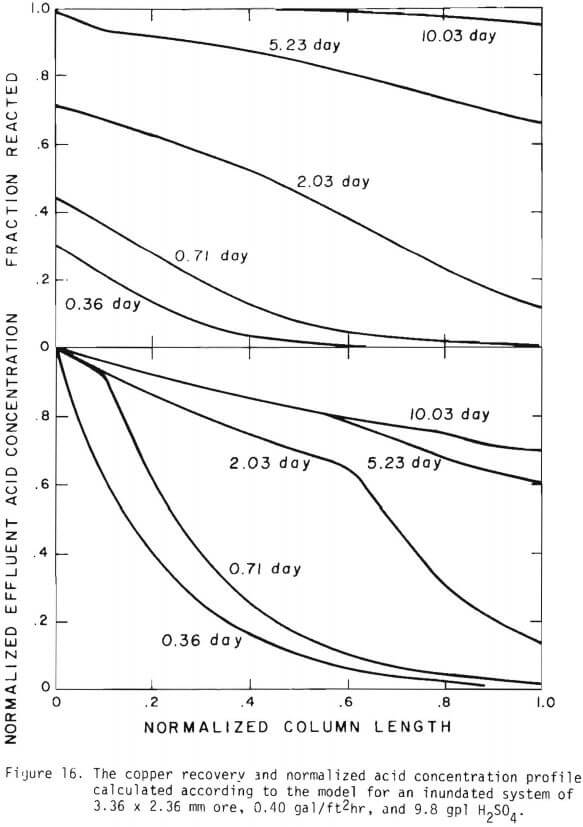
Figure 14 shows the relationship between the actual initial size of ore and the effective initial size used in the calculation. A smaller difference between the two sizes is expected for large sizes. The surface reaction term is also expected to be less important for larger sizes. The profile of hydrogen ion concentration and that of copper recovery in the column calculated according to the model are depicted in Figures 15 and 16 for two cases indicated in the figures. The same type of behavior is obtained for other cases. The apparent steady-state condition is reached sooner and a higher hydrogen ion concentration of effluent solution is obtained for faster flow rates. This can be seen in Figures 6, 7, and 8.
Introduction of the three stages simplified the calculation and the use of an effective initial size and effective surface area made it possible to evaluate the column leach results based upon the batch tests. In spite of the simplicity of the model the agreement with the experimental data is reasonable without the difficulty noted by Shafer et. al. on the variation of acid consumption of the ore as a function of copper extracted. For copper oxide leaching, a simplified version of the general formulation derived in the previous section may be used to model the leaching behavior for small scale column tests using monosized particles. The application of the model appears to be straight forward for multi-particle sized ore and extension to field conditions.
The general formulation may also be applied to sulfide leaching and uranium leaching with appropriate modification for the leaching parameters.
It must be noted that the parameters were determined based upon the experimental data on the effluent acid concentration for every case.
Bo and B1 were determined to provide a suitable data fit. As seen in Table XII there may be certain relationships between B2 and Bo, and B2 and B1. Except one case (data from reference 2) B0/B2 and B1/B2 turned out to be around 12.5 and 2.1 respectively. For the ideal case, the parameters B may be proportional to (retained liquid volume x ore mass)/ (solution flow rate x colume volume).
A model based upon the equation of continuity for mass transport is developed. A simplified version of the model has been examined for percolation leaching of copper oxide ore. Essentially, the model involves quasi-steady state diffusion of the lixiviant through the previously reacted portion of the ore particles, followed by chemical reaction at the surface of the unreacted core. The leaching behavior can reasonably be explained by the following mechanism;
- flushing of the ore with the highest rate of lixiviant consumption,
- penetration of lixiviant to react with copper mineral and gangue constituents,
- slow lixiviant consumption, mostly by gangue materials. The mechanism can be applied to both batch systems and flow systems.
The major difference in reaction rate between the two systems may be attributed to an effective surface area and subsequent effective initial size of the ore due to clustering of the ore particles and by-pass of the lixiviant in packed columns. The model provides a means to explain field test studies for copper oxide ores.